Marine Liability Pricing Analysis
Project Overview
This project explores how data-driven pricing strategies can be applied in the marine insurance sector. I developed this analysis in response to growing challenges in insurance pricing due to increasing claims and changing risk patterns in maritime operations.
I worked with a case study inspired by Oceanic Shipping Co., a fictional shipping company that has suffered substantial losses from recent claims. The goal was to design a pricing model that is both accurate and sustainable, while also providing insights into the underlying risks.
Project Goals
- Develop a detailed and transparent pricing model for Marine Liability insurance
-
Deliver a comprehensive analysis report with:
- Assumptions behind the model
- Pricing recommendations
- Commentary on risks and uncertainties
- Balance client needs, market competitiveness, and risk management
Dataset
To ensure transparency and reproducibility, the synthetic dataset used for this analysis, along with the Excel workbooks containing the pivot table analysis, are available in my project repository on GitHub.
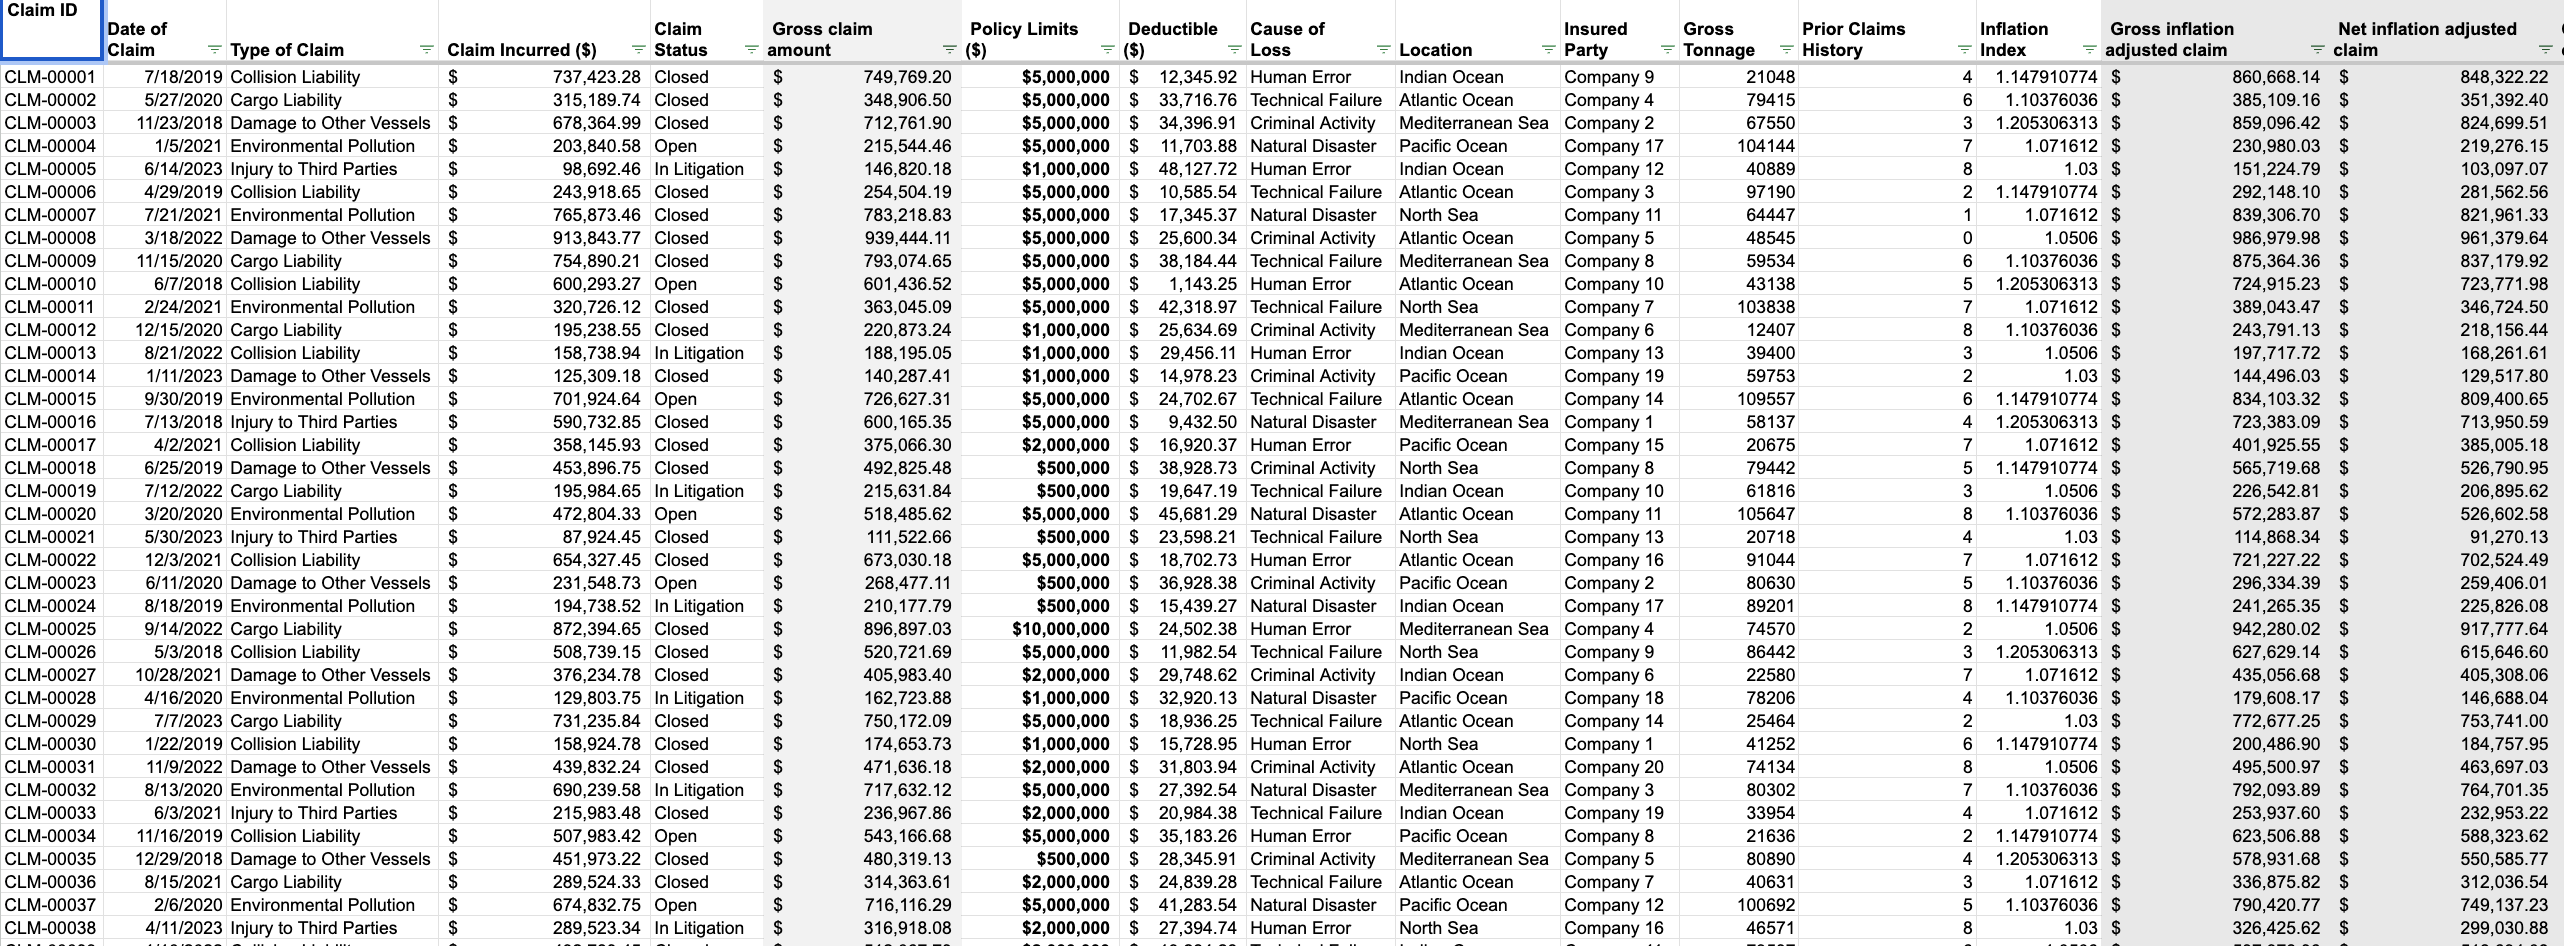
Fig a: Sample Data
Analysis Process
Given Assumptions
- Commission is 0%
- No adjustment is required for claims development patters
- Deductibles in the upcoming policy period will be the same as deductible in prior policy periods.
- Individual policies run from 1/1 - 31/12 each year
- Assume a large loss is any loss >$1m incurred
- Assume the large loss event is a 1-in-20 year event.
- Assume expenses are 30% of the loss cost.
- Assume a 10% profit requirement on this account in calculating the premium.
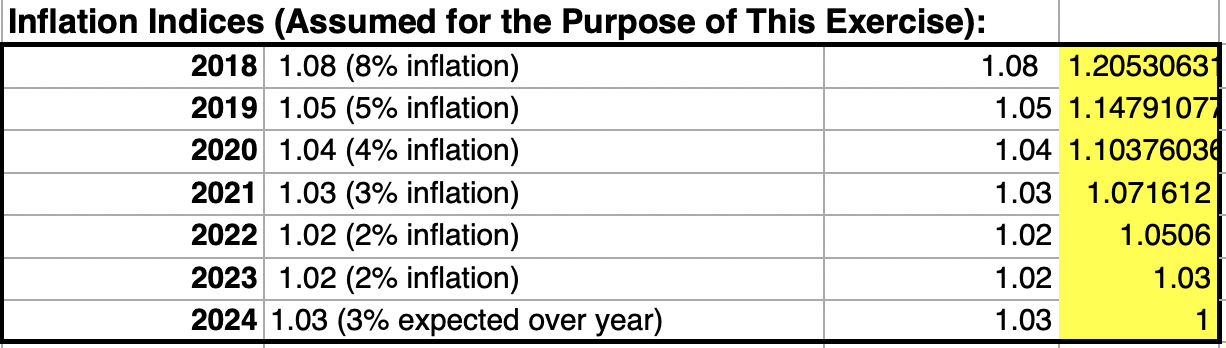
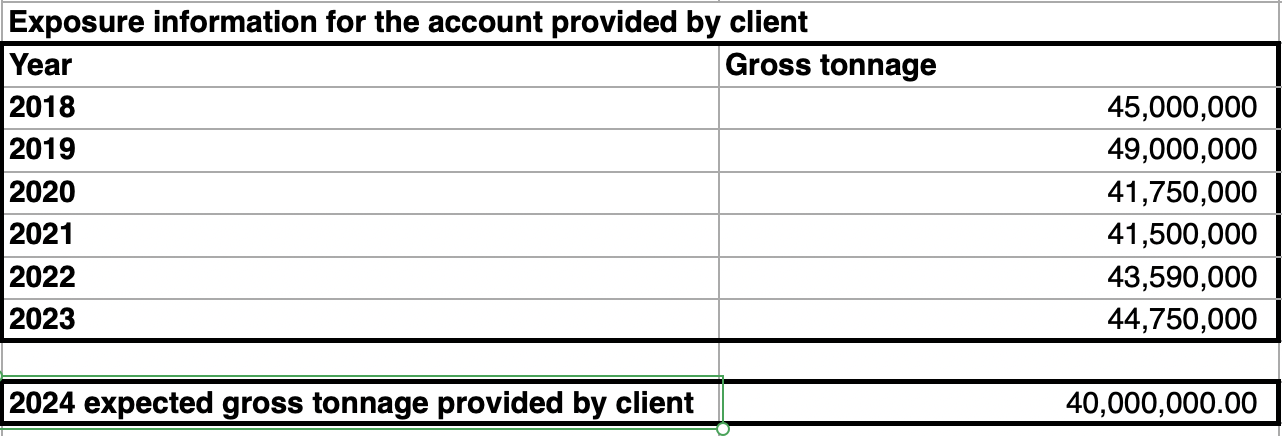
Fig 1: Inflation rate and Gross Tonnage (provided by clients)
Data Overview
The dataset comprises 100 Marine Liability claims reported between 2018 and 2023. The key variables analysed include:
- Claim Types: Collision, Cargo Liability, Damage to Other Vessels, Environmental Pollution, and Injury to Third Parties.
- Amount Gross Inflation Adjusted Claimed: Ranges from $114,000 to $5,300,000.
- Policy Limits: Vary from $500,000 to $10,000,000. Deductibles: Range from $10,000 to $50,000.
- Claim Status: 65 claims are closed, with the remainder either open or in litigation.
Data Exploration & Risk Factor Analysis
The claims data shows that:
- Collision and Environmental Pollution Liability claims are the most frequent, accounting for over 43% of all claims.
- The highest severity claims are in Environmental Pollution, with one large loss event exceeding $5 million.
- Outliers: The large loss claim in 2021 is significantly higher than other claims and will require special handling in the premium calculation.
- Claims Frequency: Steady growth over the years, with a noticeable increase in 2020 due to cargo liability claims.
1. Average Claim Amount (Adjusted for Inflation)
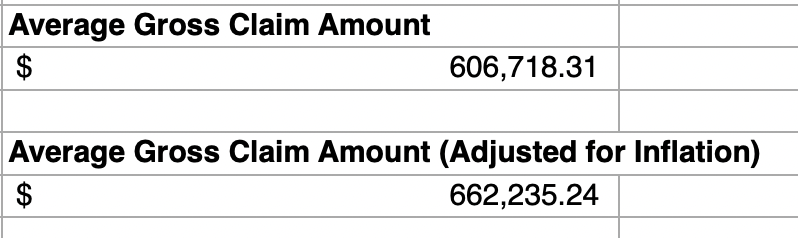
Fig 2: Average Claim Amounts for all years
2. Average Claim Amount by Year (Adjusted for Inflation)
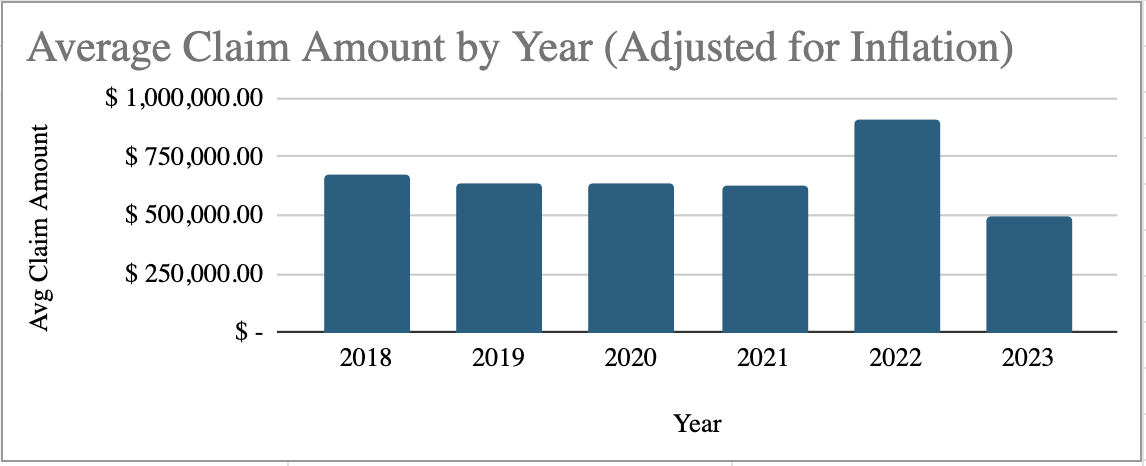
Fig 3: Average Claims Amount by Year
3. Cause of Loss Summary
The most frequent cause of loss is Technical failure followed by human error. While both of these are high frequency events, they have the lowest severity compared to the other causes of loss.
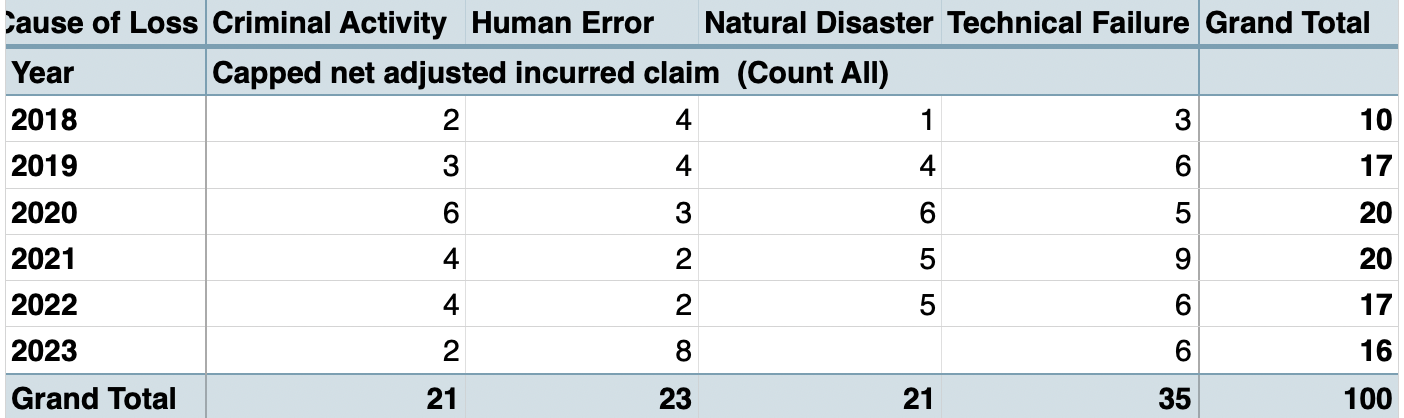
Fig 4: Number of Claims by Cause of Loss
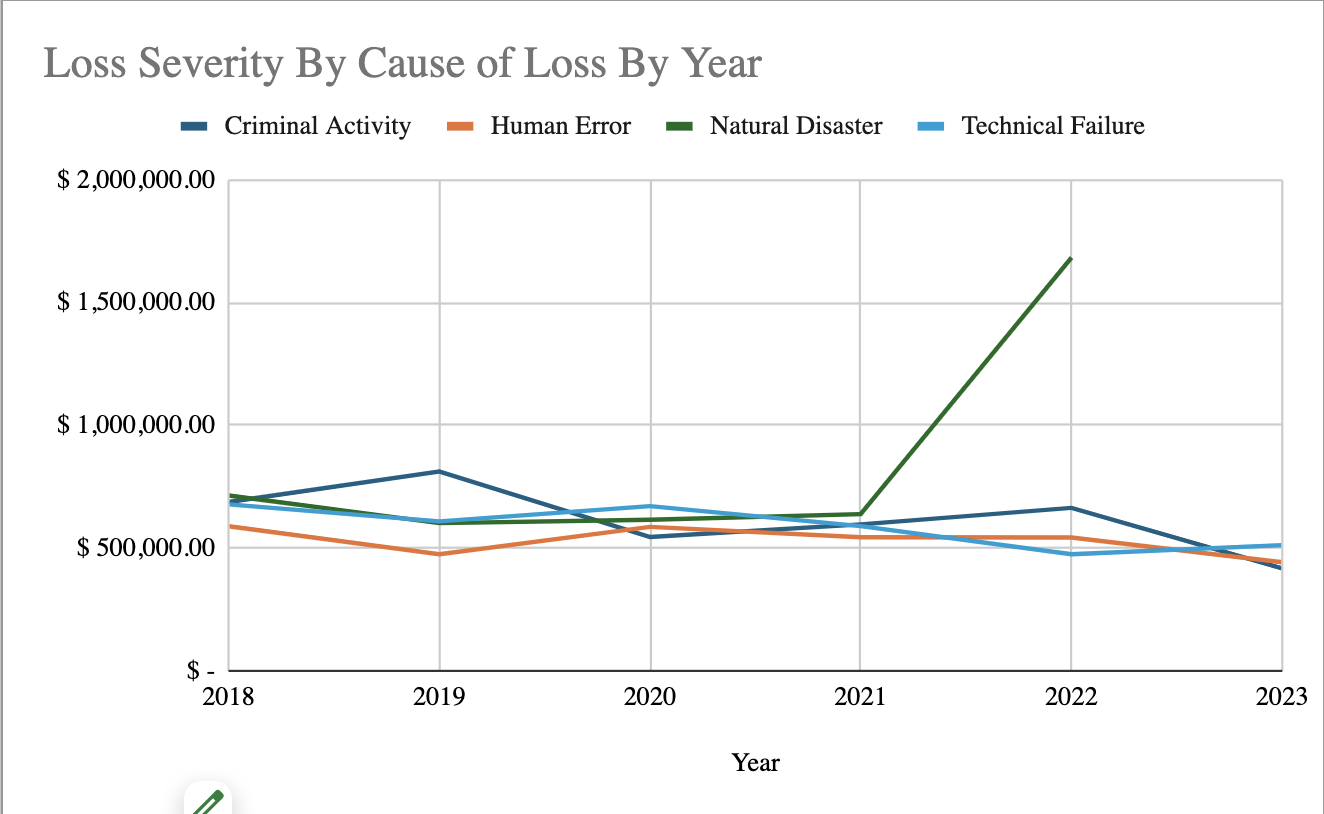
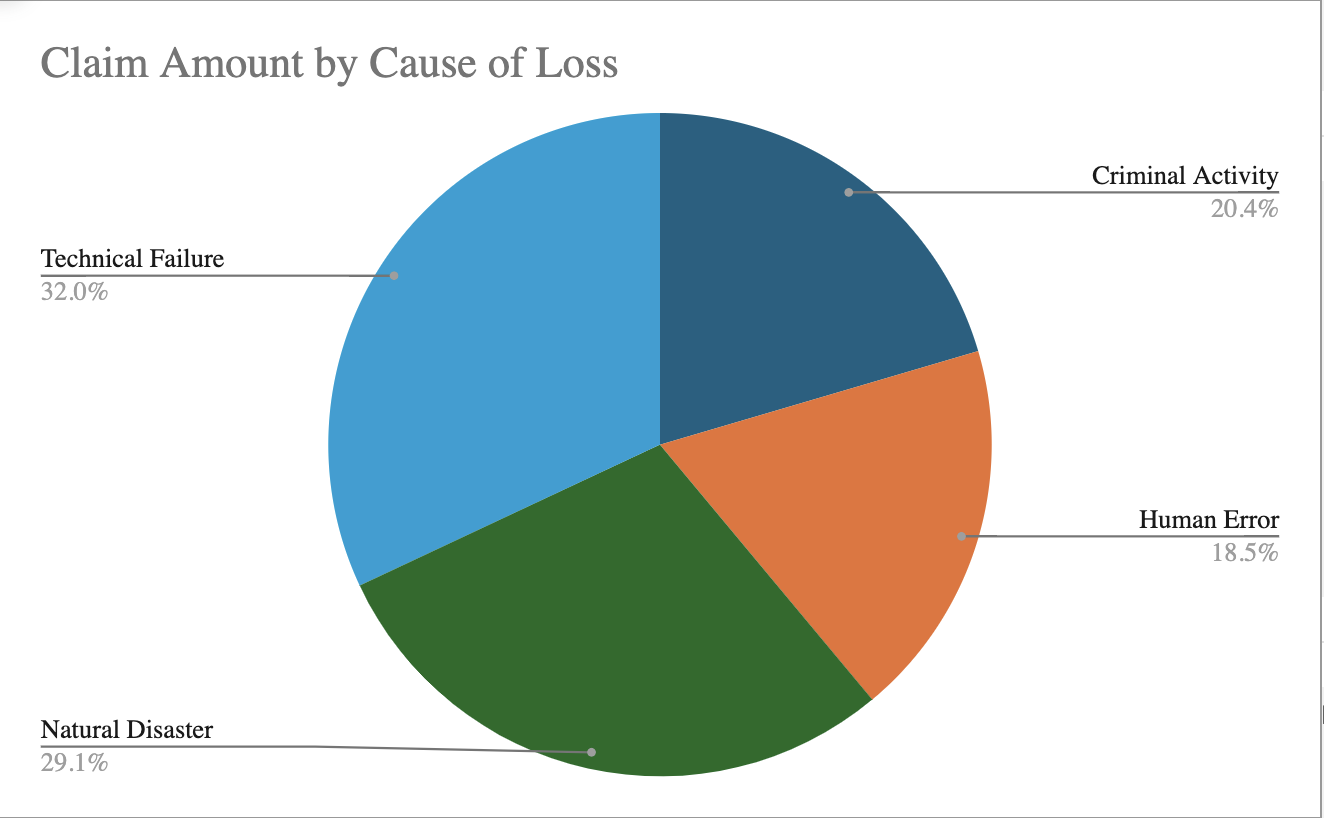
Fig 5: Loss Severity & Claims Amount by Cause of Loss
4. Locations Summary
The most common loss location is in the Atlantic ocean accounting for 23% of claims. This also is the highest severity loss location, which is partly due to the occurrence of a $5m loss in this location.
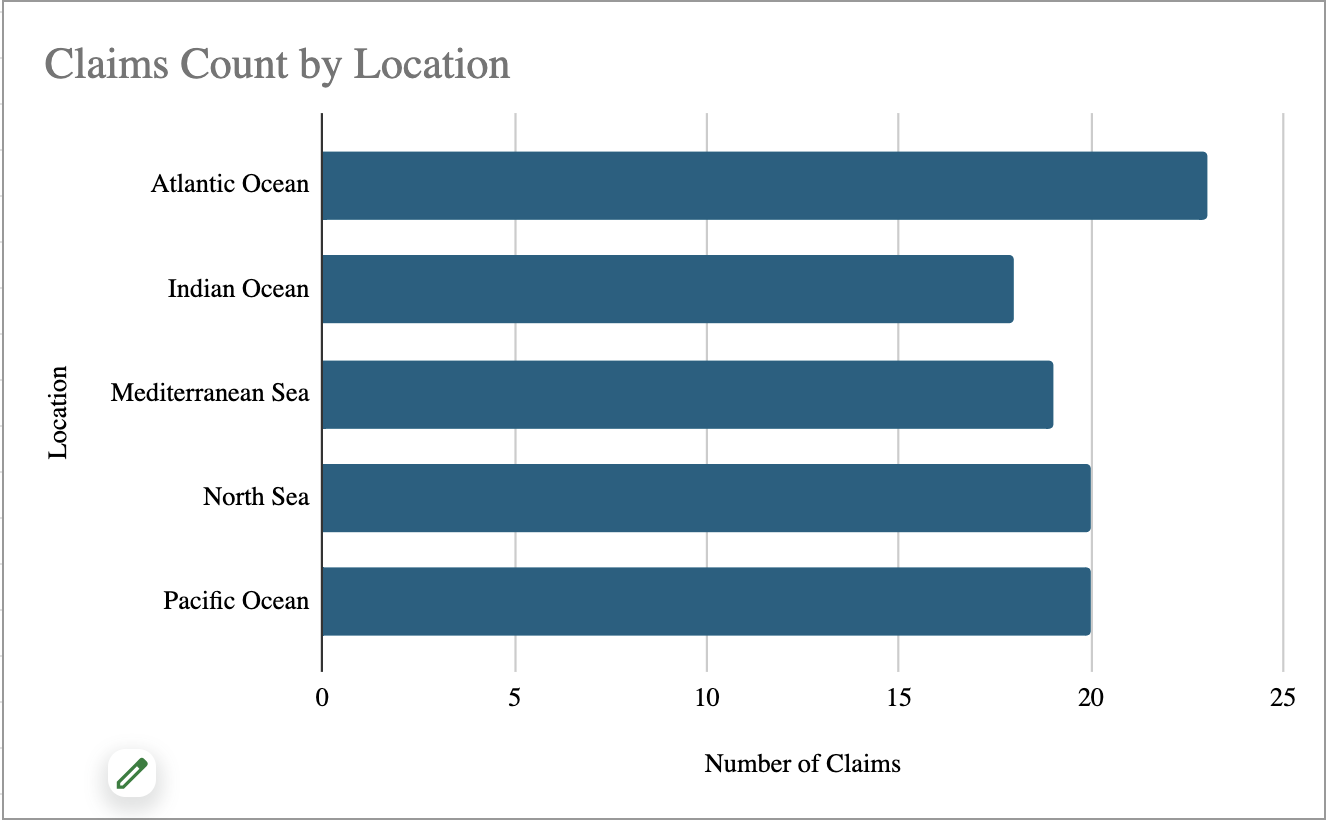
Fig 6: Number of Claims by Locations
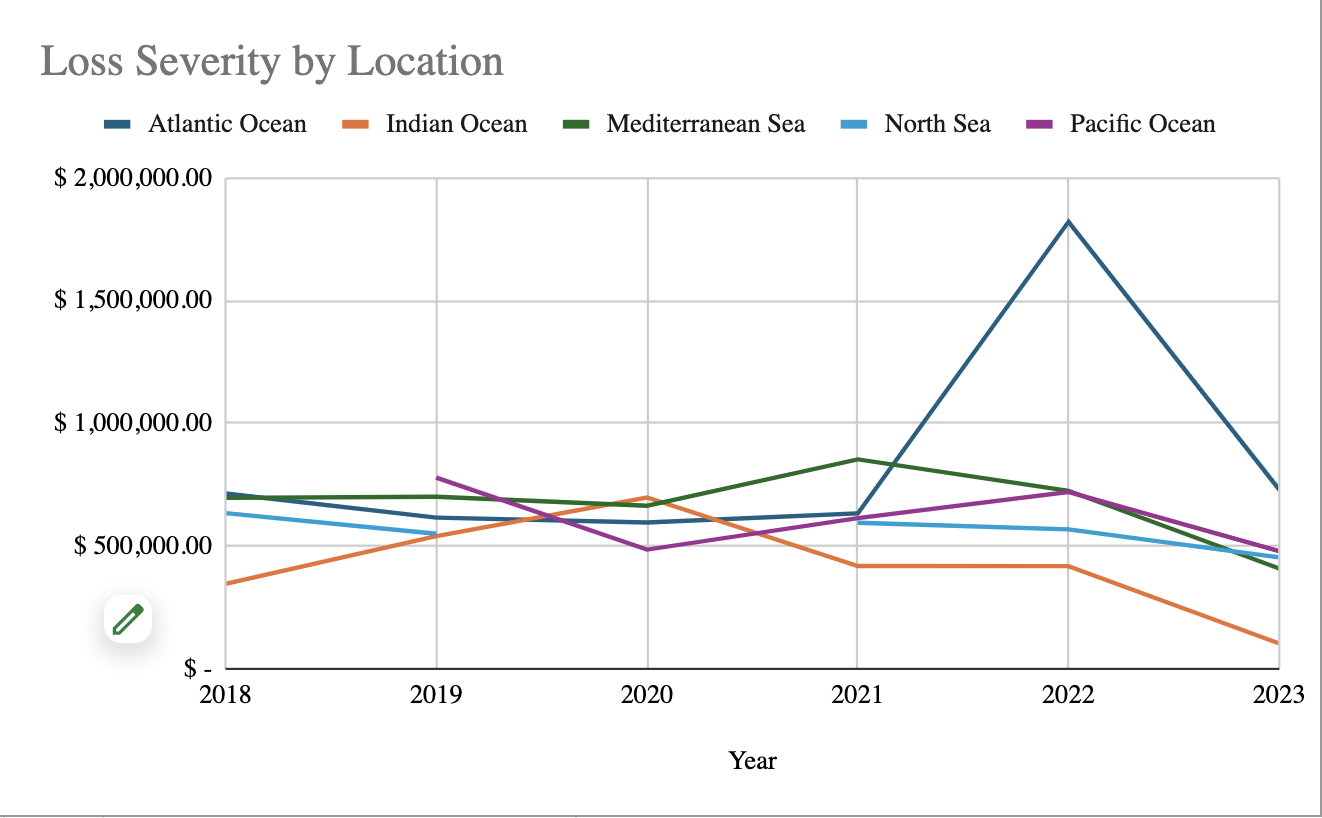
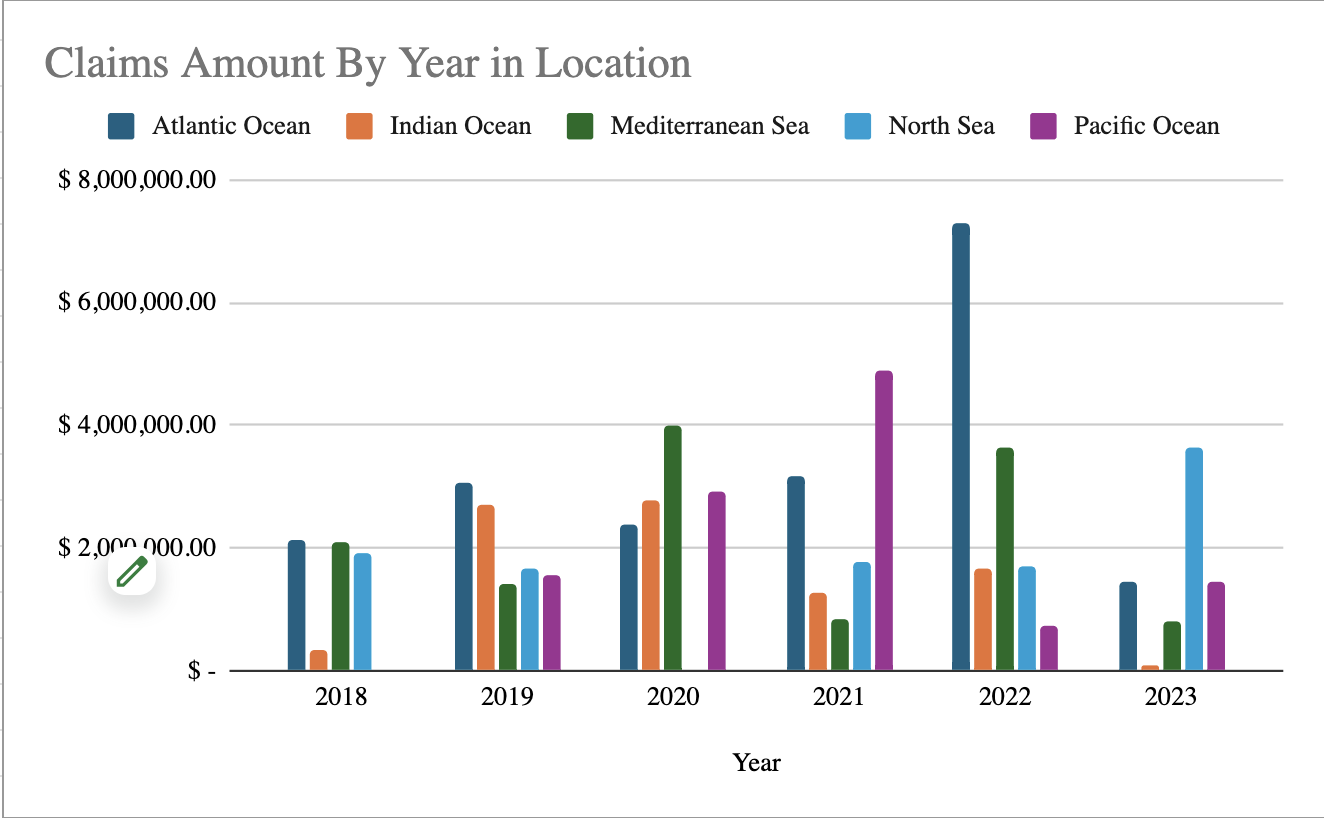
Fig 7: Loss Severity & Claims Amount by Locations
5. Claim Types Summary
Environmental Pollution poses the highest risk due to its potential for catastrophic losses, and is also the most frequent claim type observed. Collision Liability, Cargo Liability, though frequent, have lower severities.>
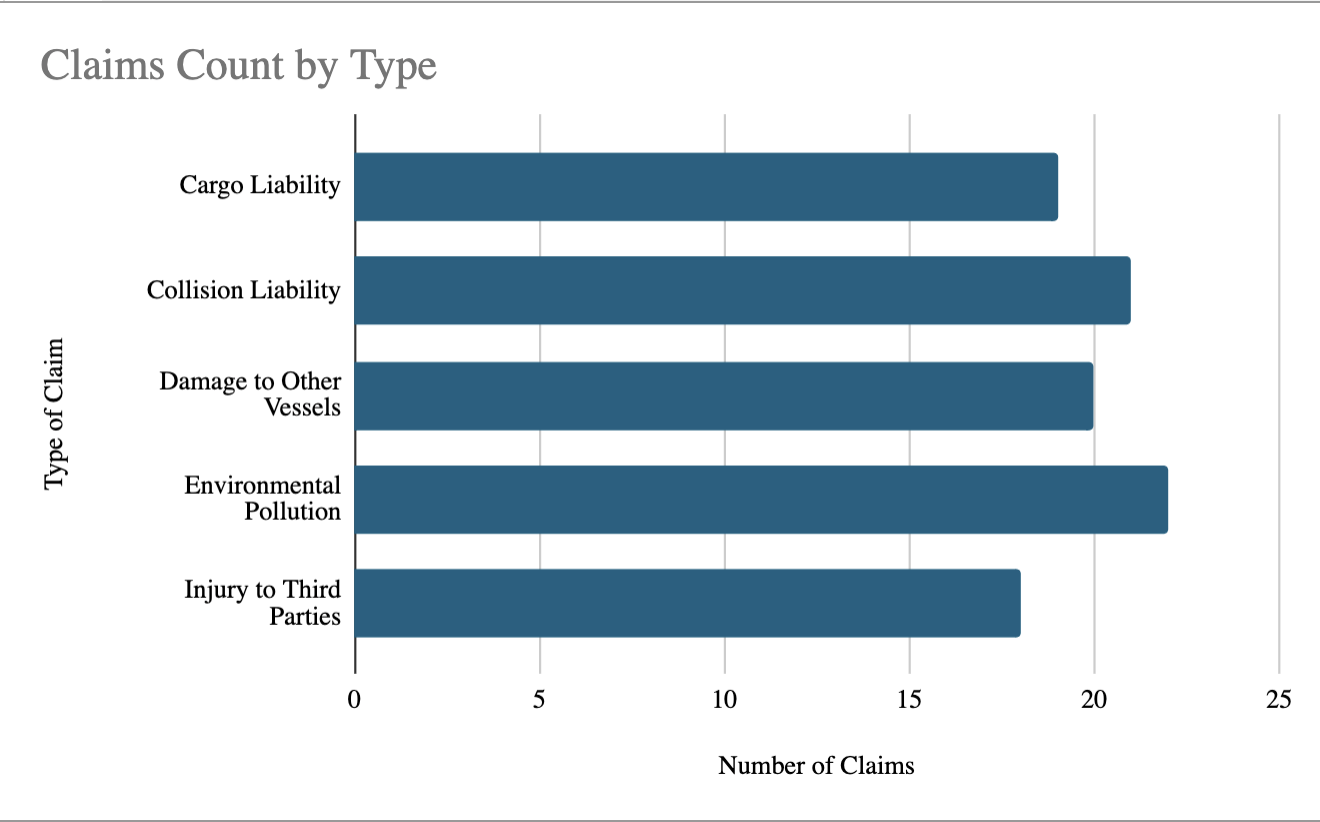
Fig 8: Number of Claims by Type of Claim
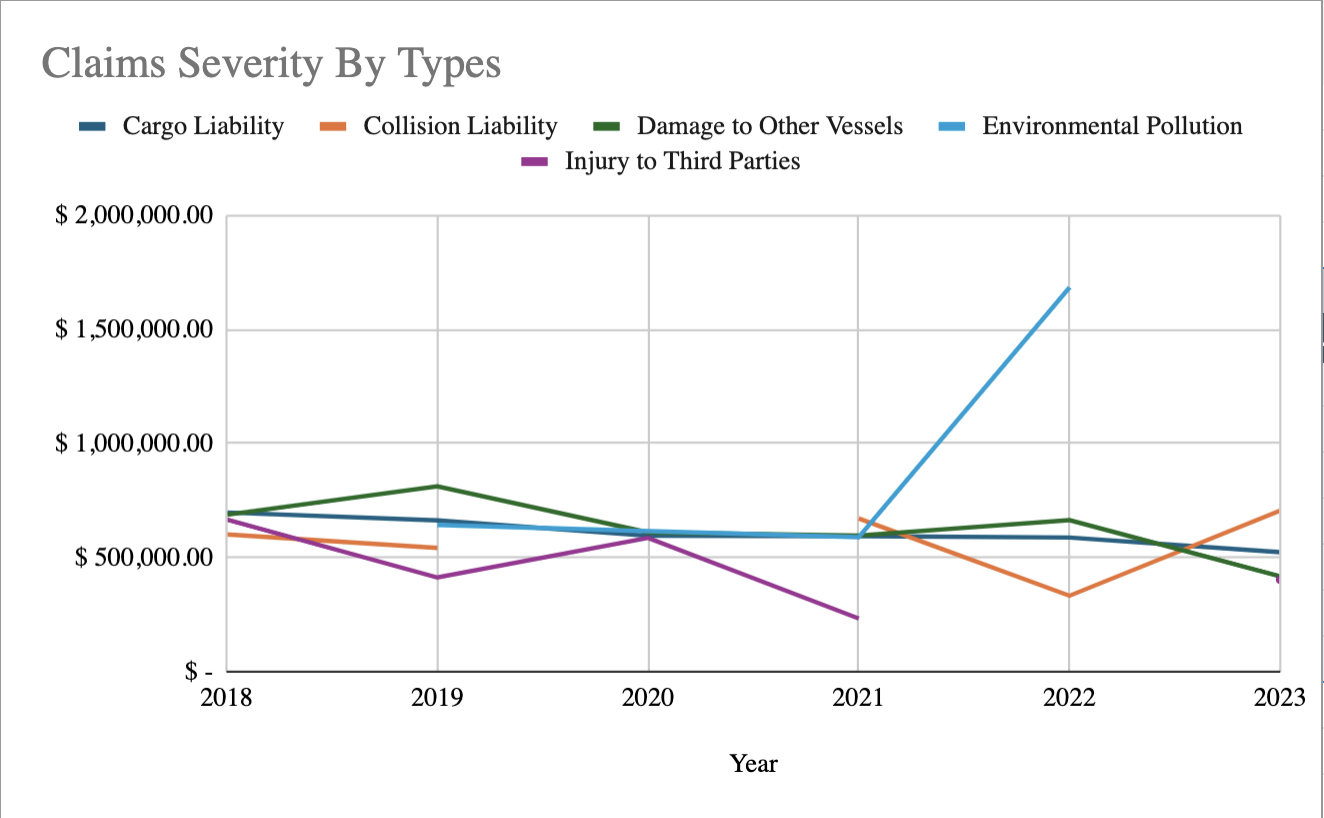
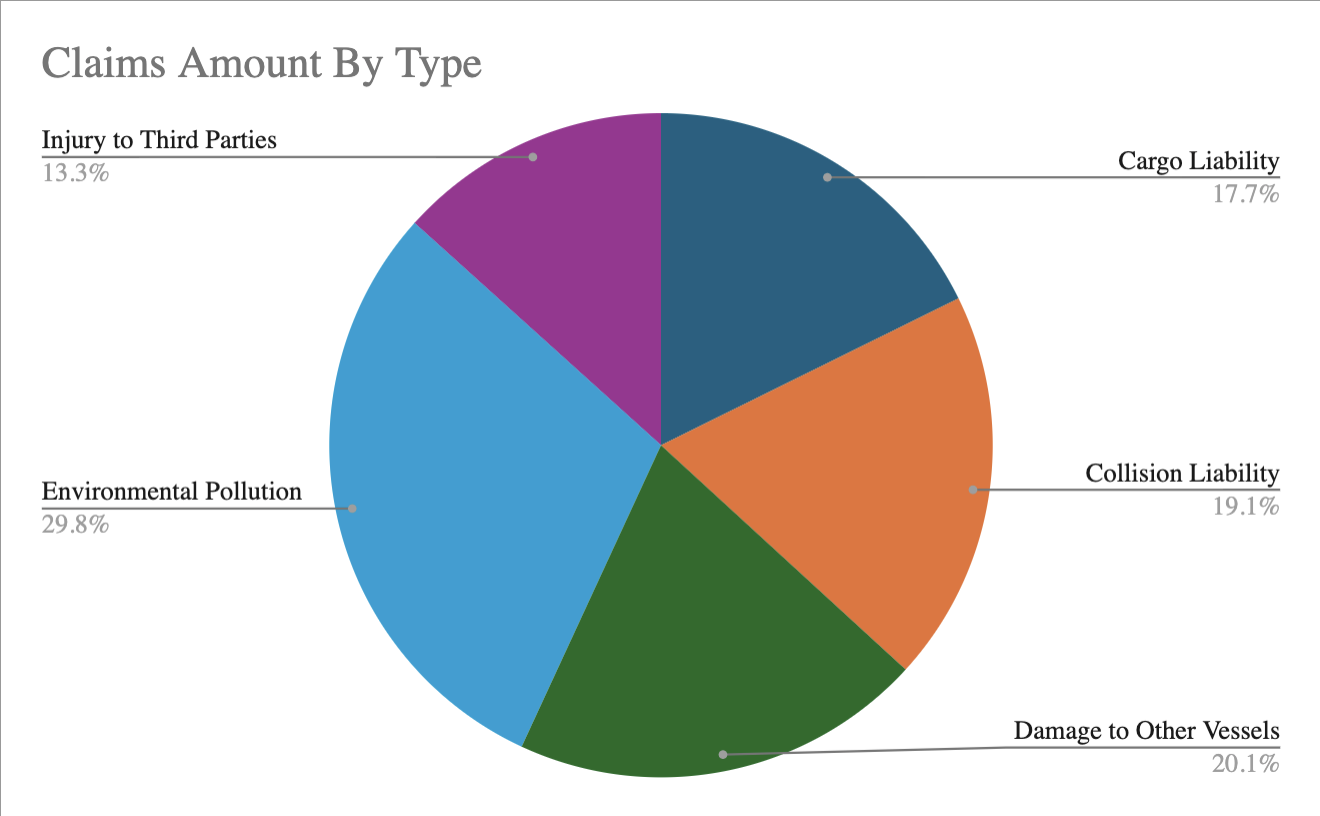
Fig 9: Claims Severity & Claims Amount by Type of Claim
Premium Calculation by Year
- Claim frequency is calculated by dividing the number of claims by the exposure at risk for each year (In this case, our exposure is gross tonnage).
- Claim severity is calculated as the sum of net incurred claims divided by the number of claims in that period.
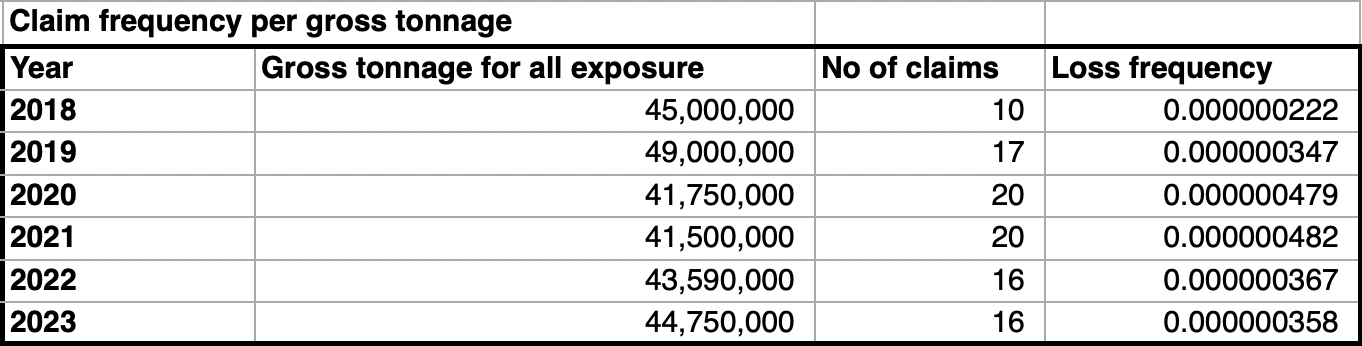
Fig 10: Claims Frequency
The expected loss per unit of gross tonnage was calculated for each year using historical loss frequency and severity, adjusted for inflation
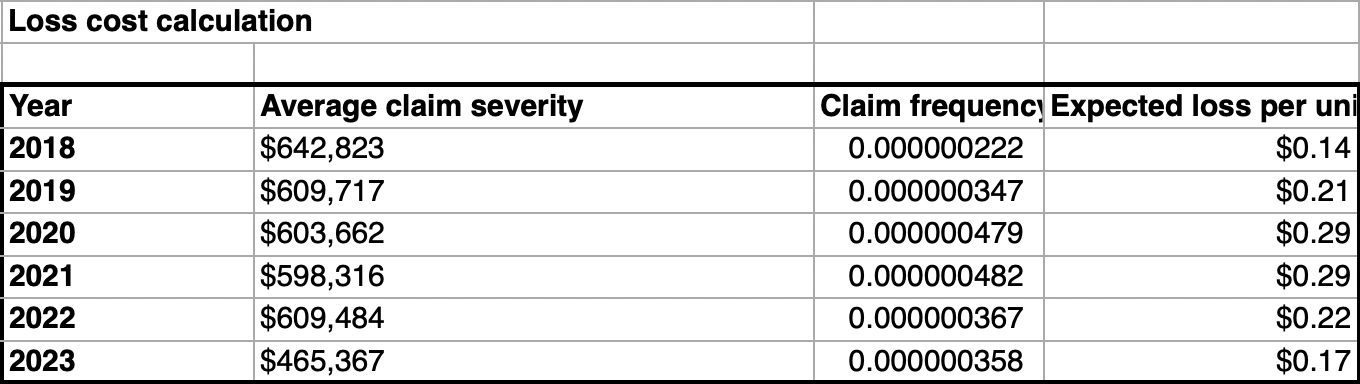
Fig 11: Loss Cost Calculation
- Average Frequency: 0.000000376
- Average Severity per Claim: $588,228
- 2024 Expected Gross Tonnage: 40,000,000 (provided by customer)
- Total Risk Premium excl. large loss loading: $8,841,969. (excluding the large loss of 5mil cause by Enviromental Polution)
- Total Risk Premium incl. large loss loading: $9,104,666.75
- Adjustments:
- Expense Loading: 30% (from assumption)
- Profit Margin: 10% (from assumption)
- Commission: Nil (from assumption)
- Large Loss Loading: A loading was applied to account for the environmental pollution event that has occurred. This has been removed from the data and added as a large loss loading to adjust for the longer expected return period of such events.
- Final Premium:
- Final Premium=Pure Premium x (1+Expense Loading)x(1+Profit Margin) =$9,104,666.75 x 1.30 x 1.10=$13,019,673.45
Sensitivity Analysis on a claim type
A sensitivity analysis was conducted to evaluate the impact of increasing claims cost on the risk premium, specifically testing how a 6% increase in severity affects the pricing. This analysis highlights how sensitive the overall premium can be to increases in claim severity. It can help us understand how material any assumptions made are as well as the potential impact of future trends e.g. if an increase in claim severity is expected due to court inflation or changes in legal rulings.
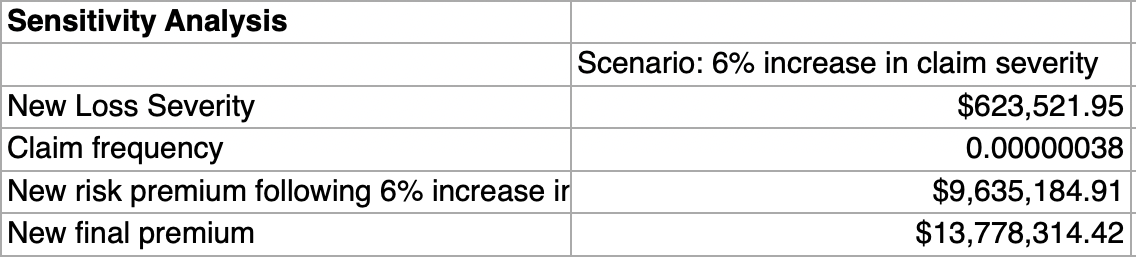
Fig 11: Sensitivity Analysis
- New Loss Severity for claims: $623,521.95
- New Pure Premium: 0.000000376 x 623,521.954 x40,000,000 +262,697.37 = $9,635,184.91
- New Office Premium: $9,635,184.91 x1.30 x 1.10 = $13,778,314.42
Key Findings
- Inflation Adjustments
- Assumption: Claims amounts from 2018 to 2023 were adjusted for inflation using industry-standard indices.
- Rationale: Inflation adjustments ensure that historical claims are compared on a like-for-like basis with claims from recent years.
- Impact: By adjusting for inflation, the premium calculation reflects the true cost of covering risks in today's economic conditions.
- Exposure (Gross tonnage)
- Assumption: 2024 gross tonnage is expected to be 40m as provided by the client.
- Rationale: Exposure is critical for adjusting the pure premium calculation, as it reflects the volume of risk the insurer covers.
- Impact: The gross tonnage directly affects the overall premium. All else equal, higher gross tonnage would lead to a higher premium as there is greater exposure to risk.
- Large loss Event and Return Period
- Assumption: A large loss event related to environmental pollution occurred in the dataset, with a claim cost of $5.1 million. We assumed that large loss events of this size occur once every 20 years.
- Rationale: Large loss events are rare but can have a significant financial impact, so the return period allows for the financial impact to be spread across several years, and adjust the premium to allow for the expected likelihood of such events reoccurring. This prevents clients facing significant premium increases following such events.
- Impact: A large loss loading was calculated and added to the premium to account for the likelihood of large loss events.
- Expense and Profit Margin Loading
- Assumption: An expense loading of 30% was applied to account for administrative costs, claims handling, and other operational expenses, and a profit margin of 10% was added to ensure profitability. A 0% commission was applied as there is no commission payable to the broker who is acting as an intermediary between the client and insurer.
- Rationale: These loadings are standard practices in insurance pricing to ensure the insurer can cover its costs and remain profitable.
- Impact: These loadings were added on top of the pure premium to calculate the final premium charged to the policyholder.
- Commission: Nil commission applied in calculation of office premium.
- Claim development patterns: No adjustment is required for claims development patterns i.e. it is assumed all policy years are 100% developed.
- Deductibles: Deductibles in the upcoming policy period will be the same as deductible in prior policy periods.
- Policy Period: Individual policies run from 1/1 - 31/12 each year.