🚗 Logistics, Delivery, and Data
I'm excited to share my latest data project: Logistics Dashboard — where I dove deep into real-world transportation data to uncover performance trends, delivery insights, and operational bottlenecks using SQL, Python, and Tableau.
🔍 Why this project?
Transportation plays a critical role in how goods and people move, yet the data behind it can be messy, complex, and full of untapped insights. I chose this project to challenge myself with real logistics data and transform it into a compelling, actionable story for business decision-makers.
💡 What I Did
- Cleaned and standardized messy location and vehicle data
- Integrated multiple datasets and inferred vehicle types from vehicle numbers
- Created user-friendly labels and fixed inconsistent formatting (lowercase, mixed text, etc.)
- Built a fully interactive dashboard in Tableau
📊 Dashboard Insights
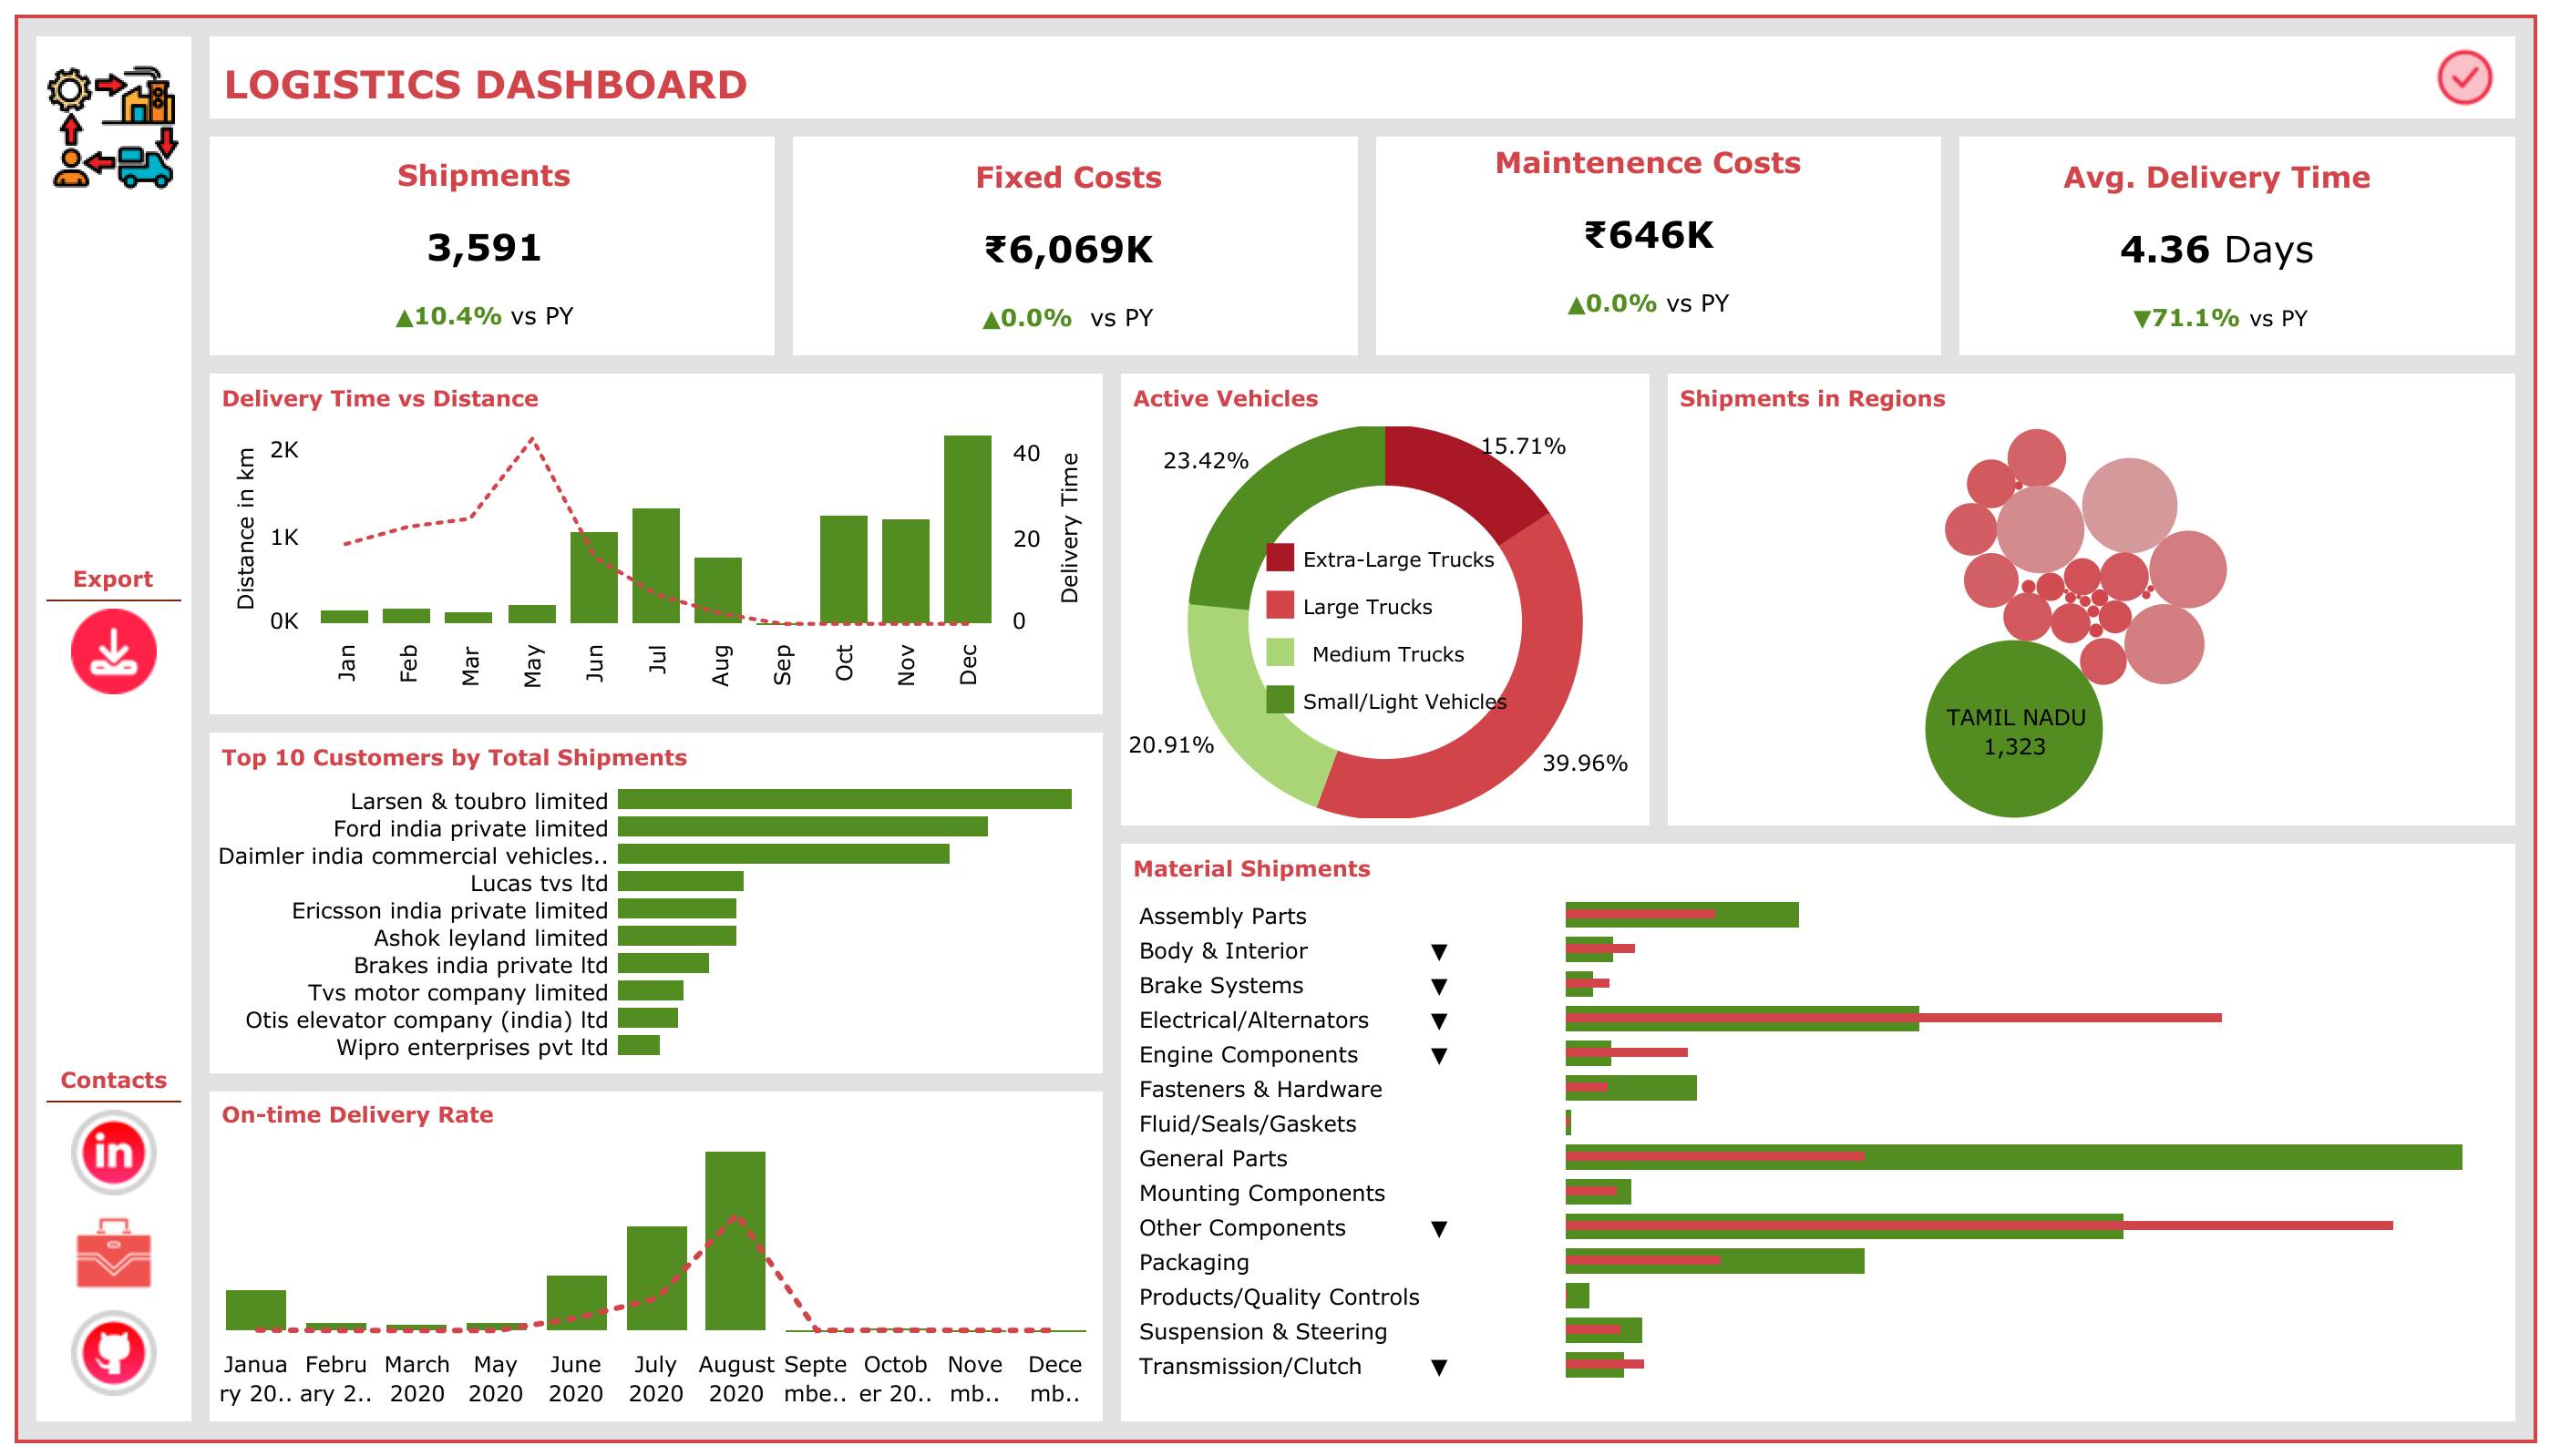
📦 Shipment Growth
+10.4% YoY increase with 71% faster delivery times
🛻 Vehicle Distribution
Large trucks made up ~40% of active vehicles
🗺️ Regional Hub
Tamil Nadu emerged as a key logistics hub (1,300+ shipments)
🧰 Cost Analysis
Stable maintenance costs with opportunities for deeper cost/shipment analysis
🔗 Explore It Yourself
This project really deepened my appreciation for combining technical analysis with user-focused storytelling. Data is only powerful when it's clear, actionable, and aligned with business goals.
📌 Challenges Overcome
- Understanding columns with little documentation
- Merging datasets with tricky joins
- Standardizing inconsistent formats and text cases
- Re-labeling technical vehicle type codes into business-friendly terms
Tech Stack
- SQL – For initial data exploration and transformation
- Python (Pandas, Matplotlib) – For deeper analysis and preprocessing
- Tableau – For interactive dashboards and storytelling
What I Learned
- Effective data storytelling requires both technical skill and user-centered design
- Even clean-looking datasets often need rigorous preprocessing
- The right questions drive more impactful insights than fancy visualizations
- Combining SQL, Python, and Tableau creates a powerful analytics pipeline