🚴 Cyclistic Bike-Share Analysis
1. Scenerio
- Launched in 2016, Cyclistic has expanded to 5,824 geotracked bikes across 692 Chicago stations, offering flexible point-to-point rentals. Its pricing includes single-ride/day passes (casual riders) and annual memberships (members).
- Finance data reveals annual members are significantly more profitable than casual riders. While flexible pricing attracts users, Marketing Director Lily Moreno sees greater potential in converting existing casual riders—who already use and trust Cyclistic—into members.
- As a Junior Data Analyst on Cyclistic’s marketing team, your mission is to uncover behavioral differences between casual riders and annual members of this Chicago-based bike-share program. With leadership prioritizing membership growth, your data-driven insights will directly shape conversion strategies—but executive approval hinges on rigorous analysis and persuasive visual storytelling.
Business Task
Analyze usage patterns between annual members and casual riders to identify key behavioral differences that inform conversion strategies.
2. Data Sources
- The analysis leverages 13 months of Cyclistic's ride-share data (April 2024-April 2025), comprising over 5.8 million trips across 692 Chicago stations.
- This dataset, made available through Motivate International Inc.'s public data program, under this license , stored in standardized CSV formats for analysis.
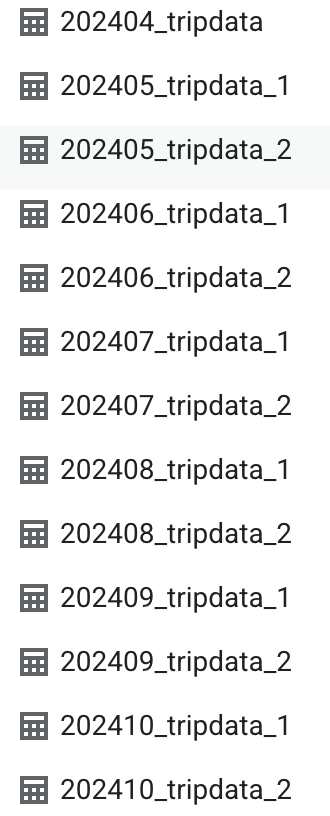
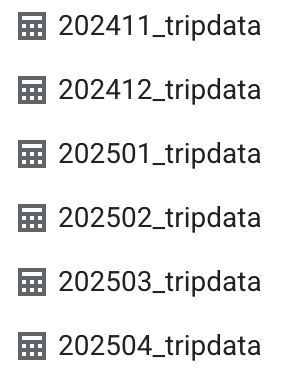
Fig 1: List of tables from 04/2024 to 04/2025
Data includes:
- ride_id
- rideable_type: classic, docked, electric
- started_at: trip start day and time
- ended_at: trip end day and time
- start_station_name
- start_station_id
- end_station_name
- end_station_id
- start_lat : start station latitude
- start_lng : start station longitude
- end_lat : end station latitude
- end_lng : end station longitude
3. Data Cleaning & Preparation
Upload files to Google BigQuery
- To efficiently analyze the large dataset (approximately 6 million records), I implemented a scalable solution using Google BigQuery and SQL for data cleaning, manipulation, and analysis.
- Due to file size constraints (some exceeding 100MB), I first preprocessed the data by dividing these files into smaller segments using Python, as shown in the script below.

Fig 2: Python Script to divide large files into smaller segments
Union all tables
- After uploading all files to Google BigQuery, I consolidated the datasets using UNION ALL to enable comprehensive analysis.
- The following query merges all source tables into a temporary table combine_tables using UNION ALL:
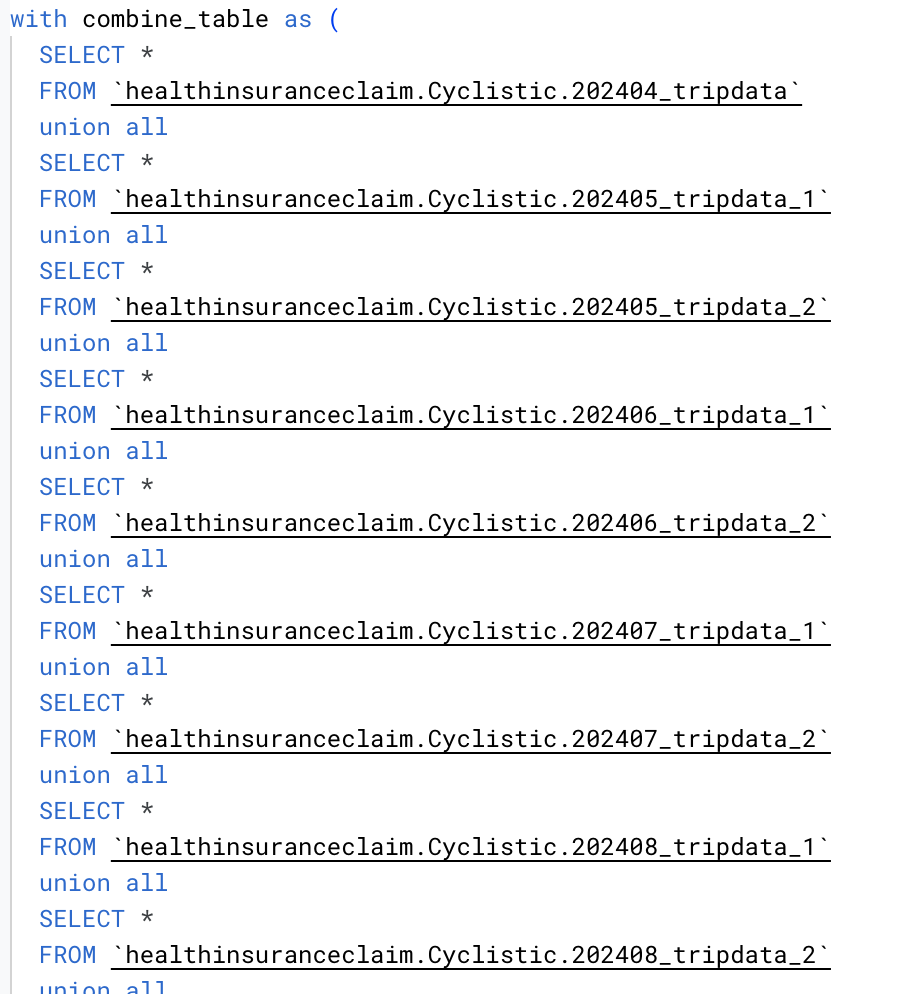
Fig 3: SQL query to union all tables
Add columns
- To analyze trip durations, I derived a new ride_duration_in_mins metric by computing the time difference between ended_at and started_at timestamps, converted to minutes.
- The new wk_days column (1-7 representing Sunday-Saturday) revealed meaningful usage patterns across different weekdays.
- Finally, I created a quarter field to enable seasonal trend analysis.
- Save result into a temporary table name add_extra_col

Fig 4: SQL query to add extra columns
Data Cleaning
- I used case-when to transform wk_days from number (1-7) to (Sun-Sat)
- Check and filter null value
- Save result into a temporary table name clean_table
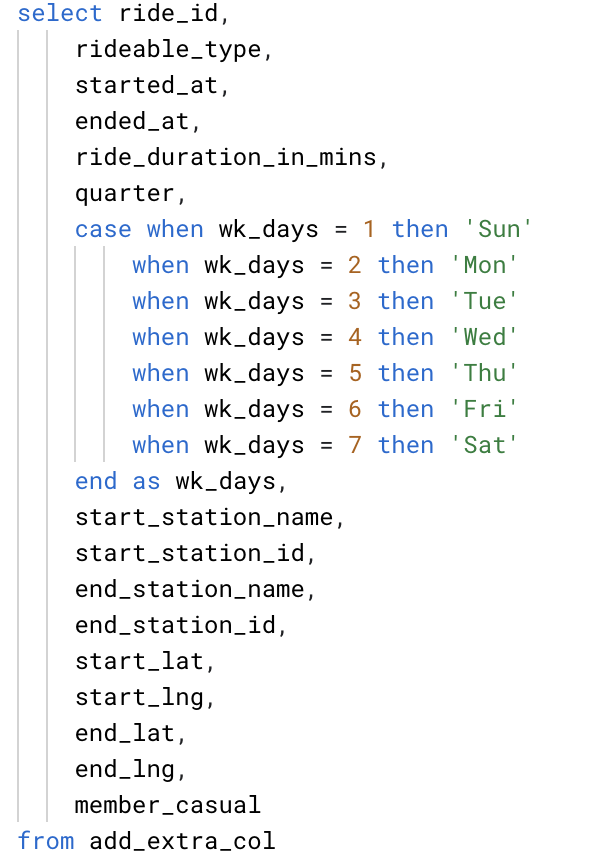
Fig 5: SQL query to clean data
4. Analysis Summary
Usage Patterns
- Strong weekday member usage suggests subscription-based commuting
- Weekend casual peaks align with leisure/recreational use
- Weekdays (Mon-Fri) show significantly higher member usage (all >63%)
- Weekends (Sat-Sun) see more balanced ratios
- Target frequent weekend casual riders with membership incentives
- Weekend pricing/promotions could optimize casual-to-member conversion
- Balance bike availability for weekday commuter peaks
Strategy:
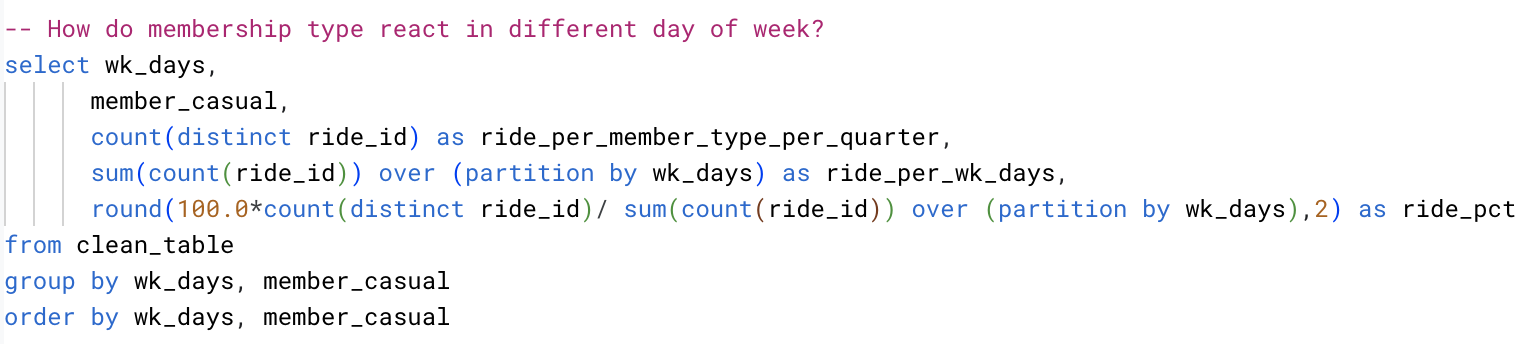
Fig 6: SQL query to see how uesage patterns during a week
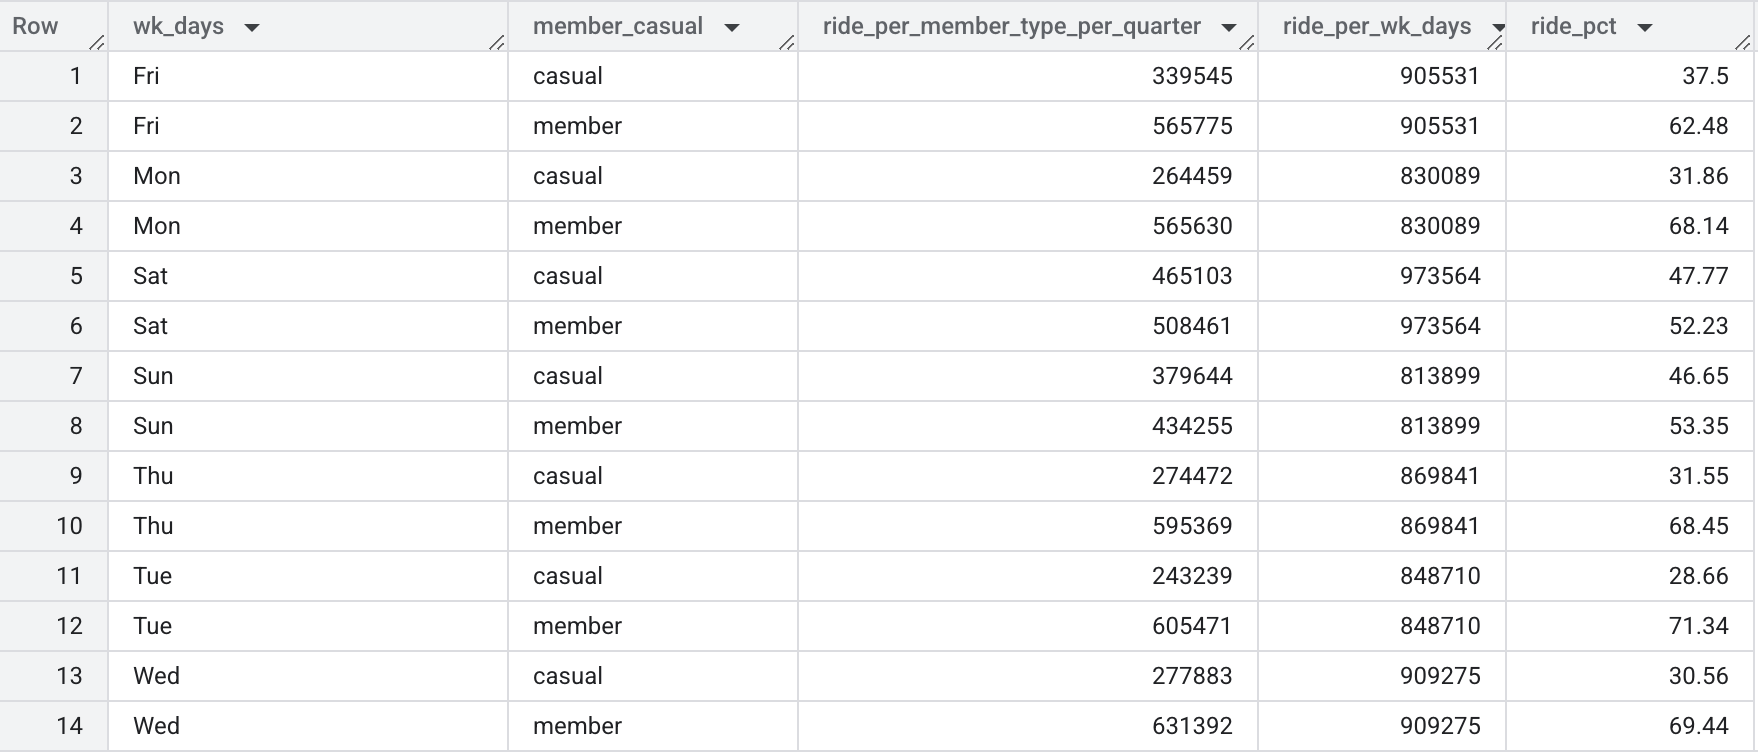
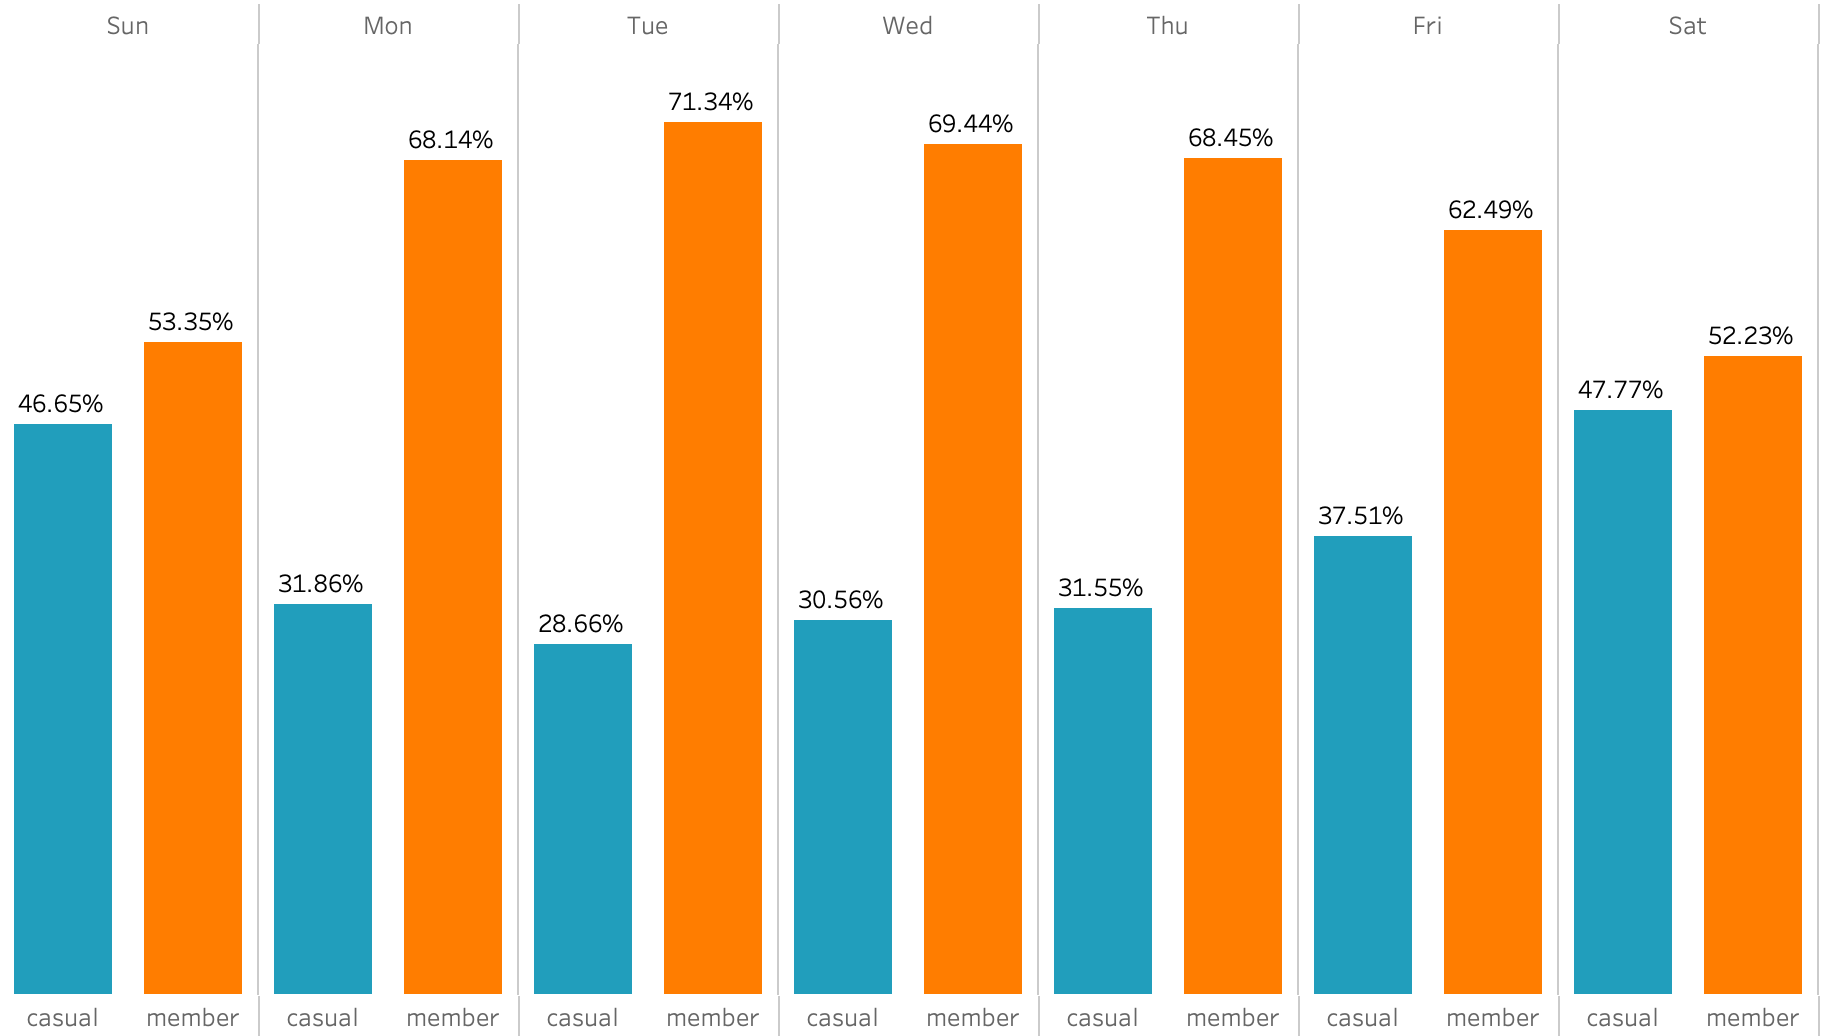
Fig 7: Usage patterns result and chart
Usage trend in a day
- Member show stronger commuter peaks (7-9 AM and 4-6 PM)
- Casual peaks align with ridership remains higher than members between 10 AM-3 PM
- Casual Rider Daily Patterns
- Morning (8-10 AM): Moderate usage (~150K rides) - likely leisure activities/tourists
- Afternoon (12-4 PM): Strong peak (~250-350K rides) - suggests lunch outings and daytime exploration
- Evening (5-7 PM): Secondary peak (~200K rides) - possibly dinner/entertainment trips
Strategy:
- Partner with cafes: "Show 5 morning rides, get free coffee + membership discount"
- Team with restaurants/bars: "Dinner special: Show bike receipt, get 10% off meal + 20% off annual membership"
- For casuals making regular 8 AM rides: "Your morning routine could save $X/month as a member"
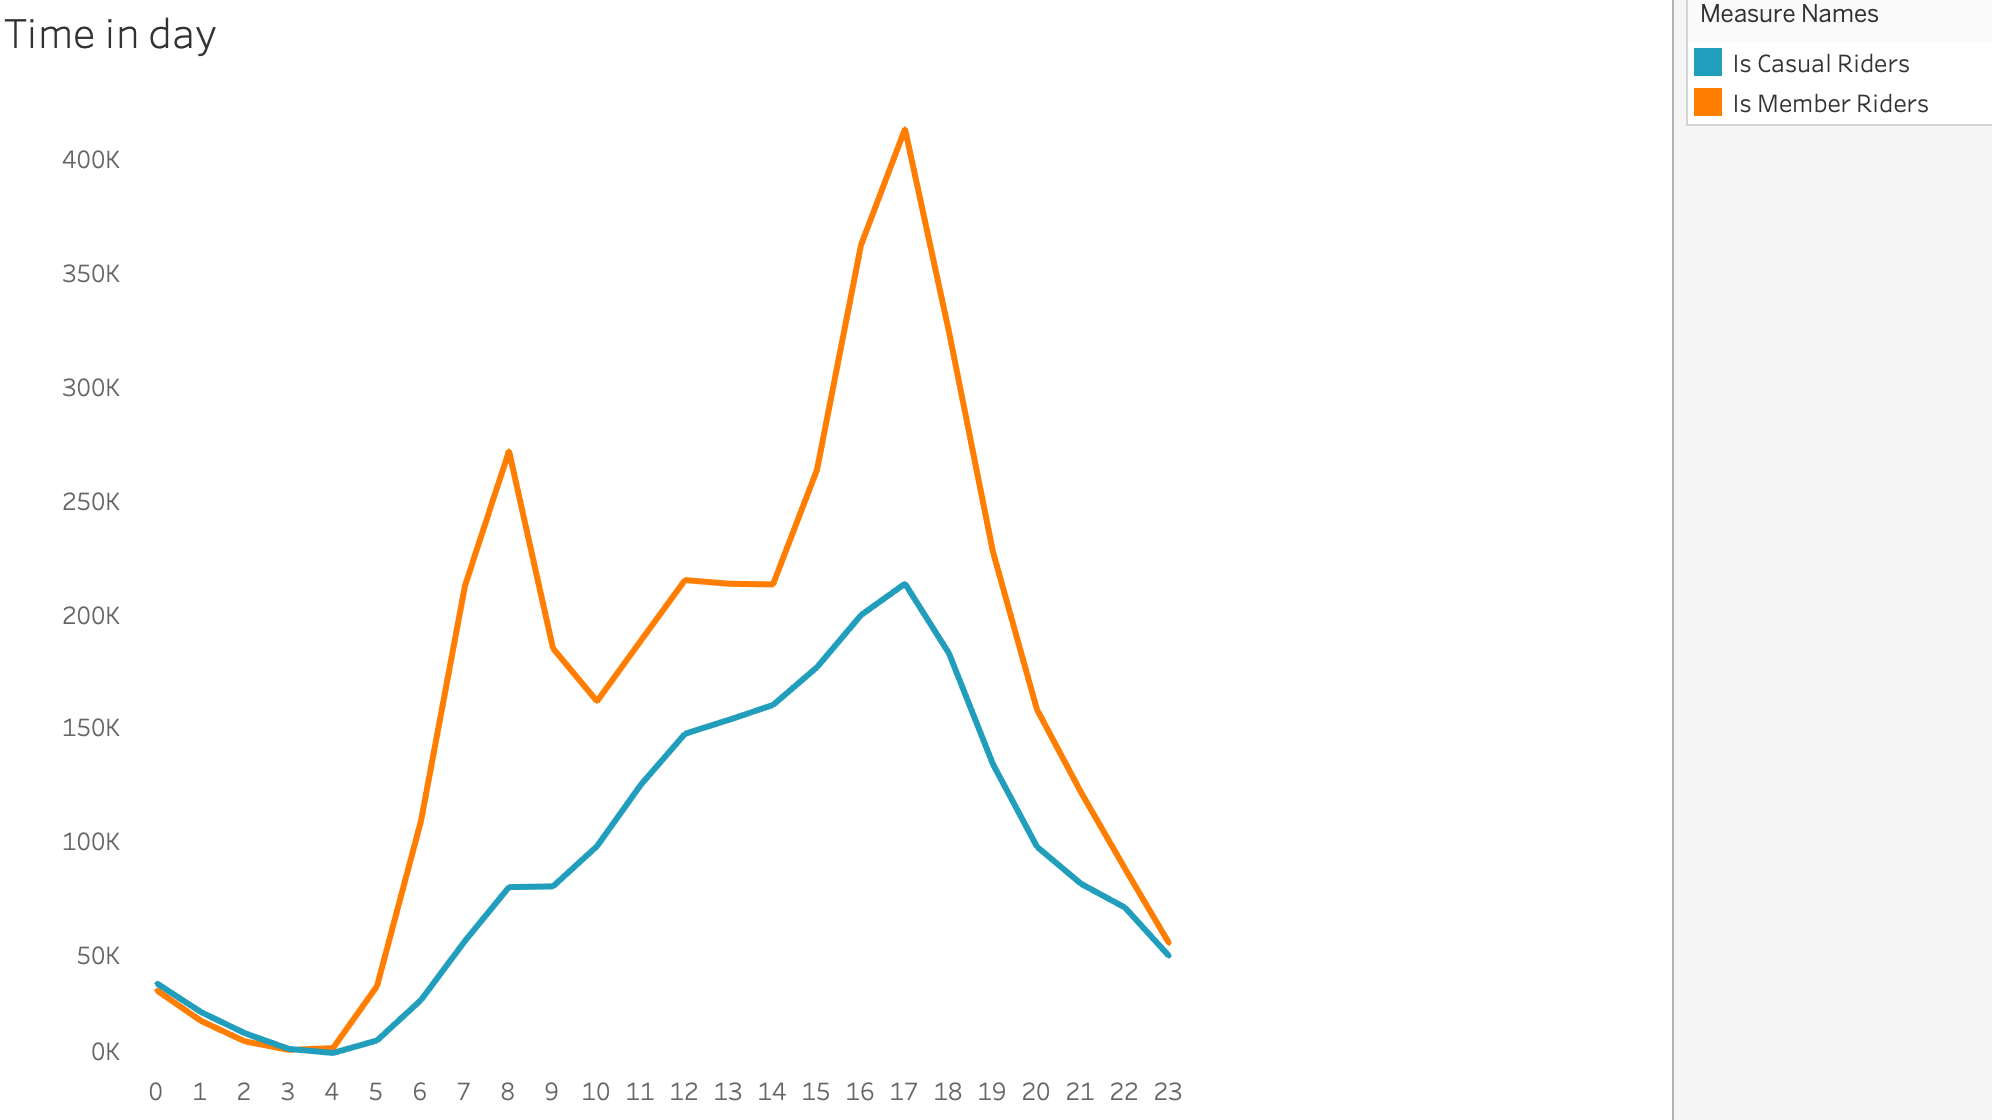
Fig 8: Trending time in a day
Ride Duration
- Casual riders consistently show longer average ride durations than members across all days
- Members likely use bikes for short, predictable commutes (consistent 11-min weekday rides)
- Casual riders exhibit leisure-oriented usage (longer weekend rides)
- Casual riders' longer durations make them more sensitive to per-minute charges
- Opportunity: "Upgrade to membership and ride longer for less" campaigns
- Target casual weekend users with membership promotions highlighting:
- Cost savings for frequent/longer rides
- Convenience for recreational use
Pricing Strategy:

Fig 9: Ride duration query
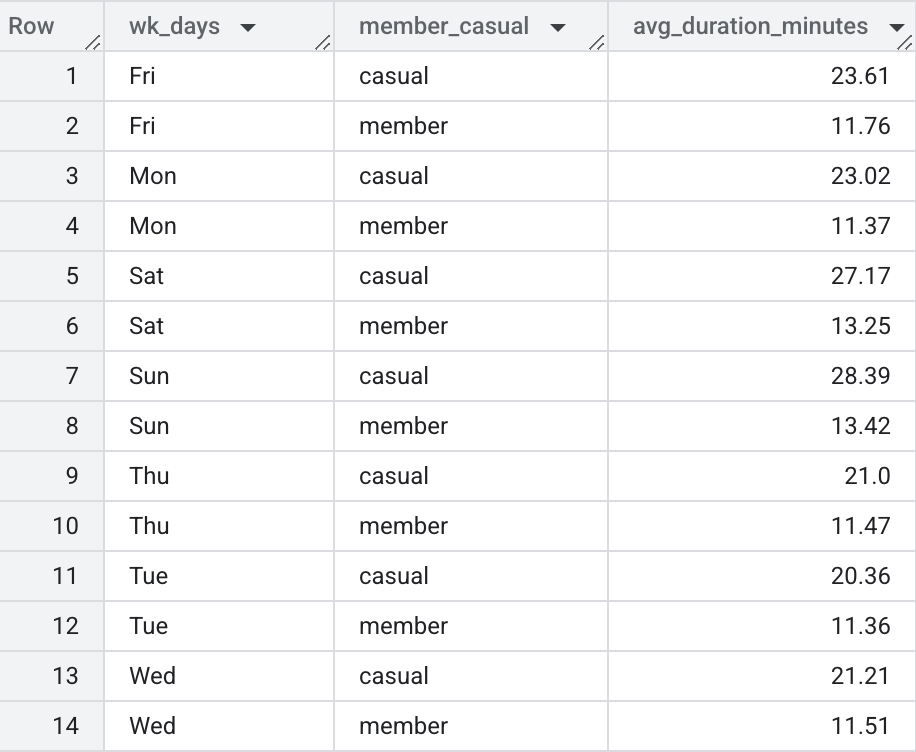
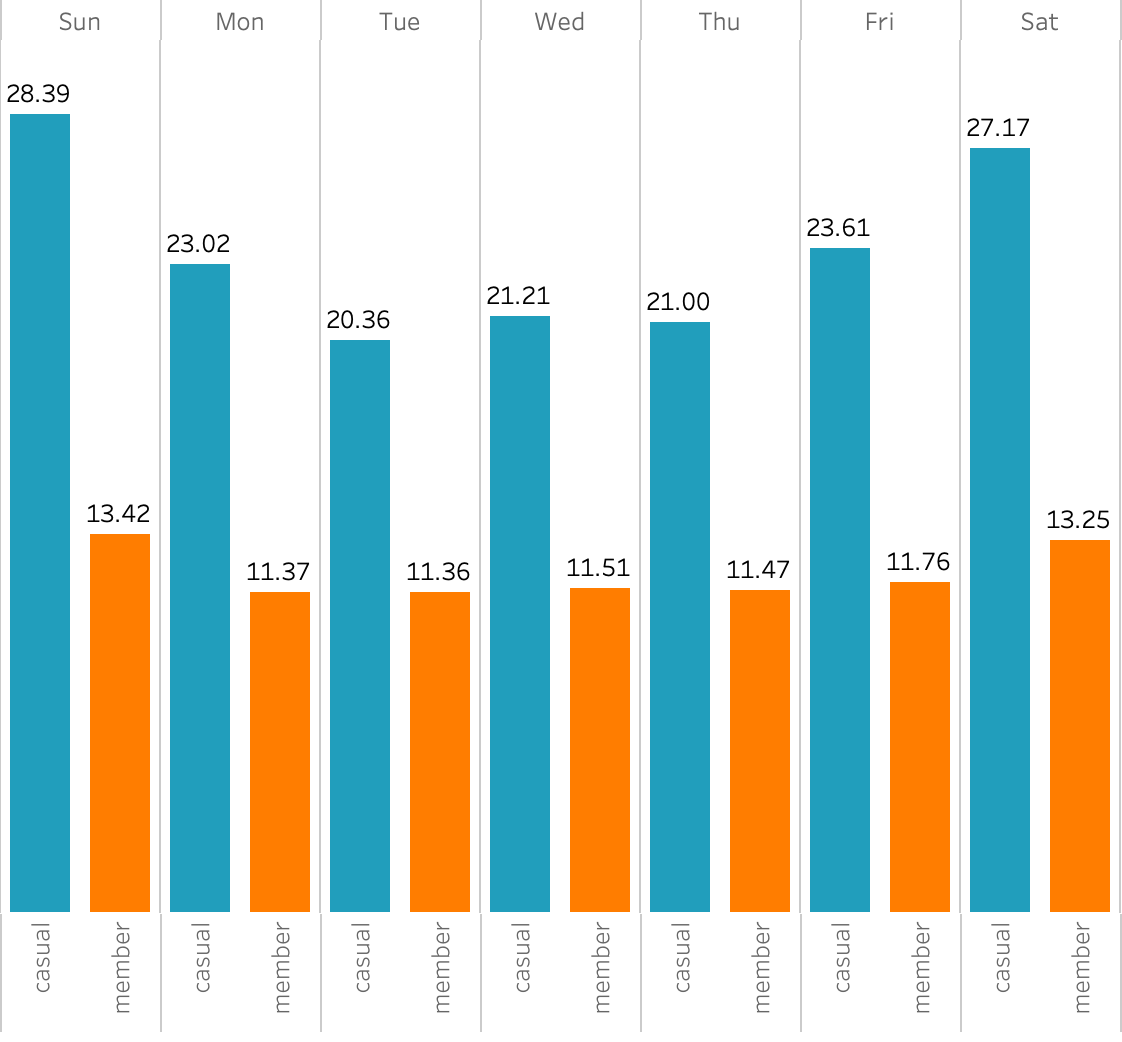
Fig 10: Ride duration query result and chart
Bike Types
- "Unlimited e-bike access" campaign
- Highlight electric bikes' speed/effort savings in marketing
- Offer free e-bike upgrades for first 5 member rides
- Target casual scooter users with:
- 30-min free member trial on scooters
- "Scooter Weekends" promo (discounted member access Sat-Sun)
Electric Scooters have highest casual rider share (40.96%)
Recommendations:

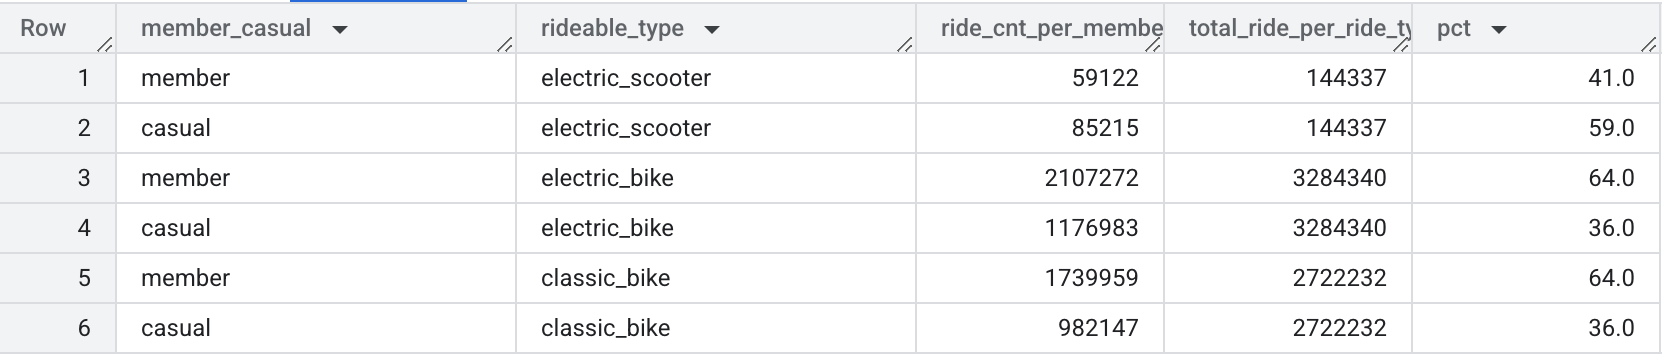
Fig 11: Bike type query and result
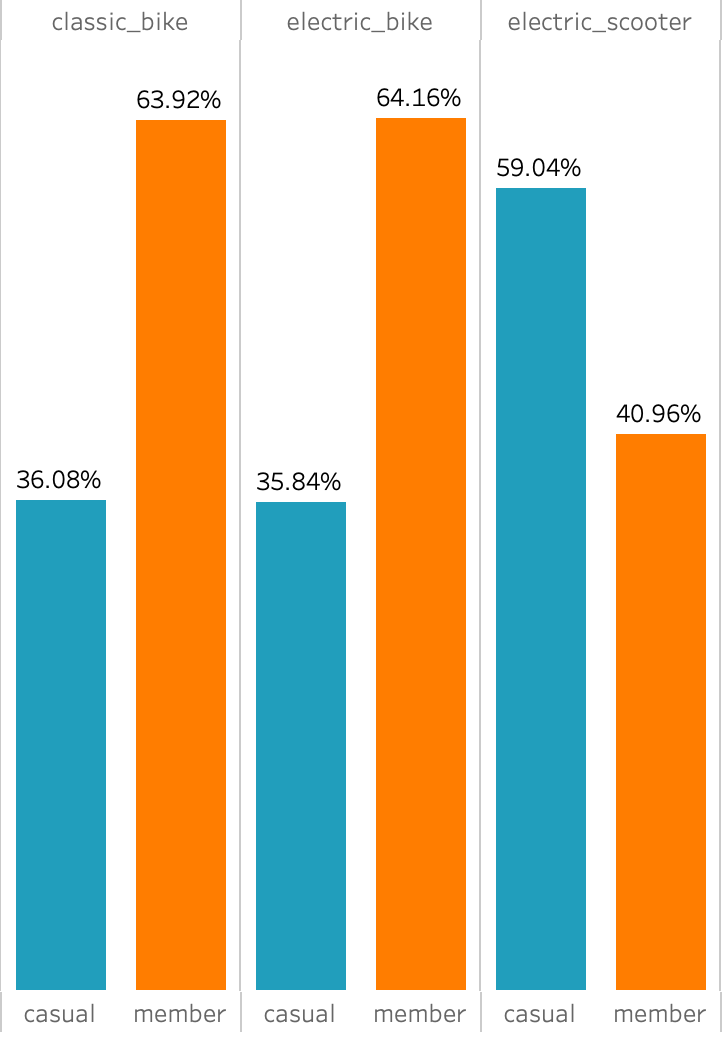
Fig 12: Bike type chart
Seasonal Trends
- Casual riders are highly weather-dependent, with a ~20% swing between peak (Q3) and off-peak (Q1)
- Highest Casual Ridership:
- Q3 (Summer): 42.37% of rides (peak leisure season)
- Q2 (Spring): 29.41% (rising temperatures, outdoor activity)
- Lowest Casual Ridership:
- Q1 (Winter): 23.40% (cold weather reduces demand)
- Q4 (Fall): 38.26% (declines after summer but still significant)
- Summer (Q3): Best time to upsell memberships (riders are active & engaged).
- Tactic: "Unlimited Summer Pass" (June–August, discounted rate).
- Spring (Q2): Target casual riders early before peak season.
- Tactic: "Early Bird Membership" (sign up in April, get bonus ride credits).
- Winter (Q1): Incentivize continued usage.
- Tactic: "Winter Warrior Challenge" (5 rides in January = free month).
- Fall (Q4): Prevent drop-off post-summer.
- Tactic: "Fall into Savings" (discounted membership rollover).
Recommendations:
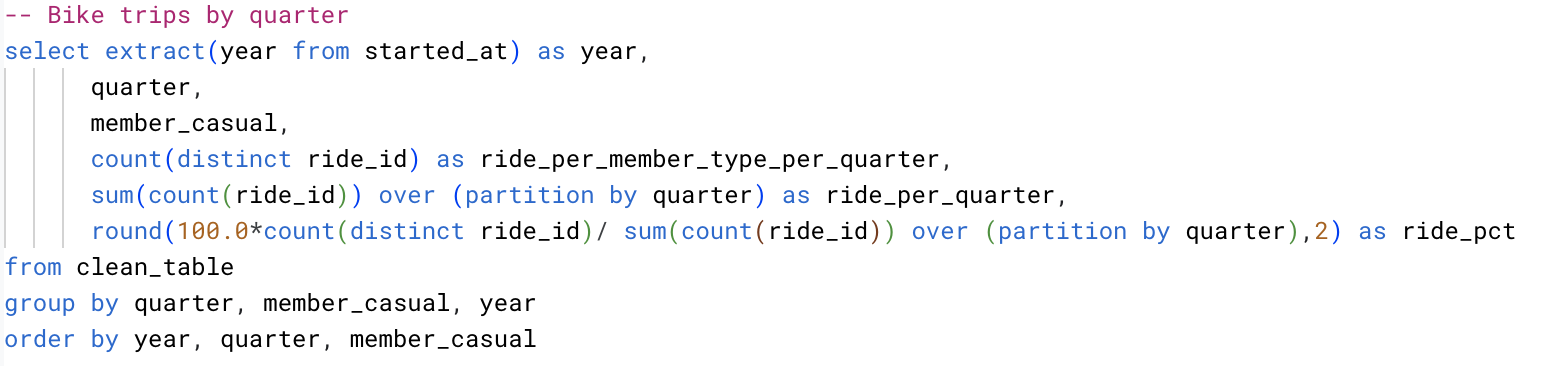
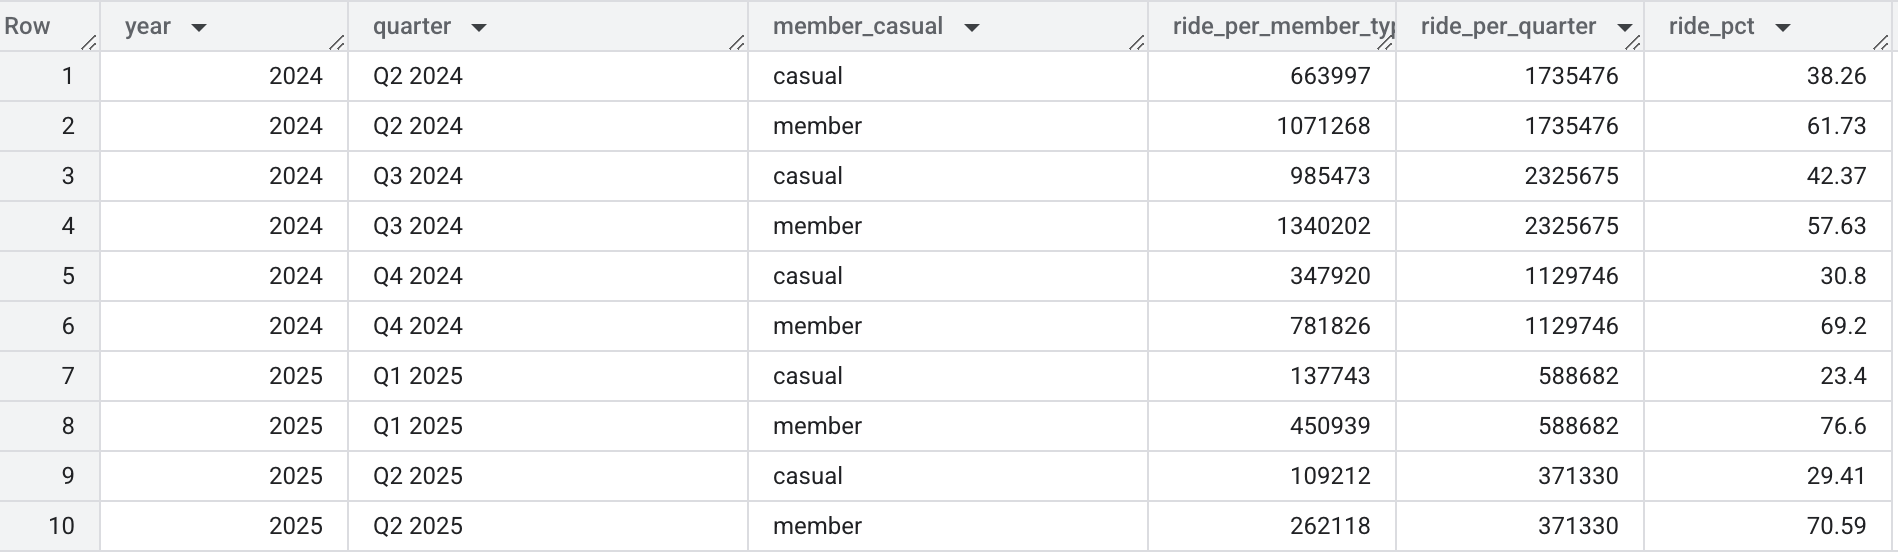
Fig 13: Seasonal trend query and result
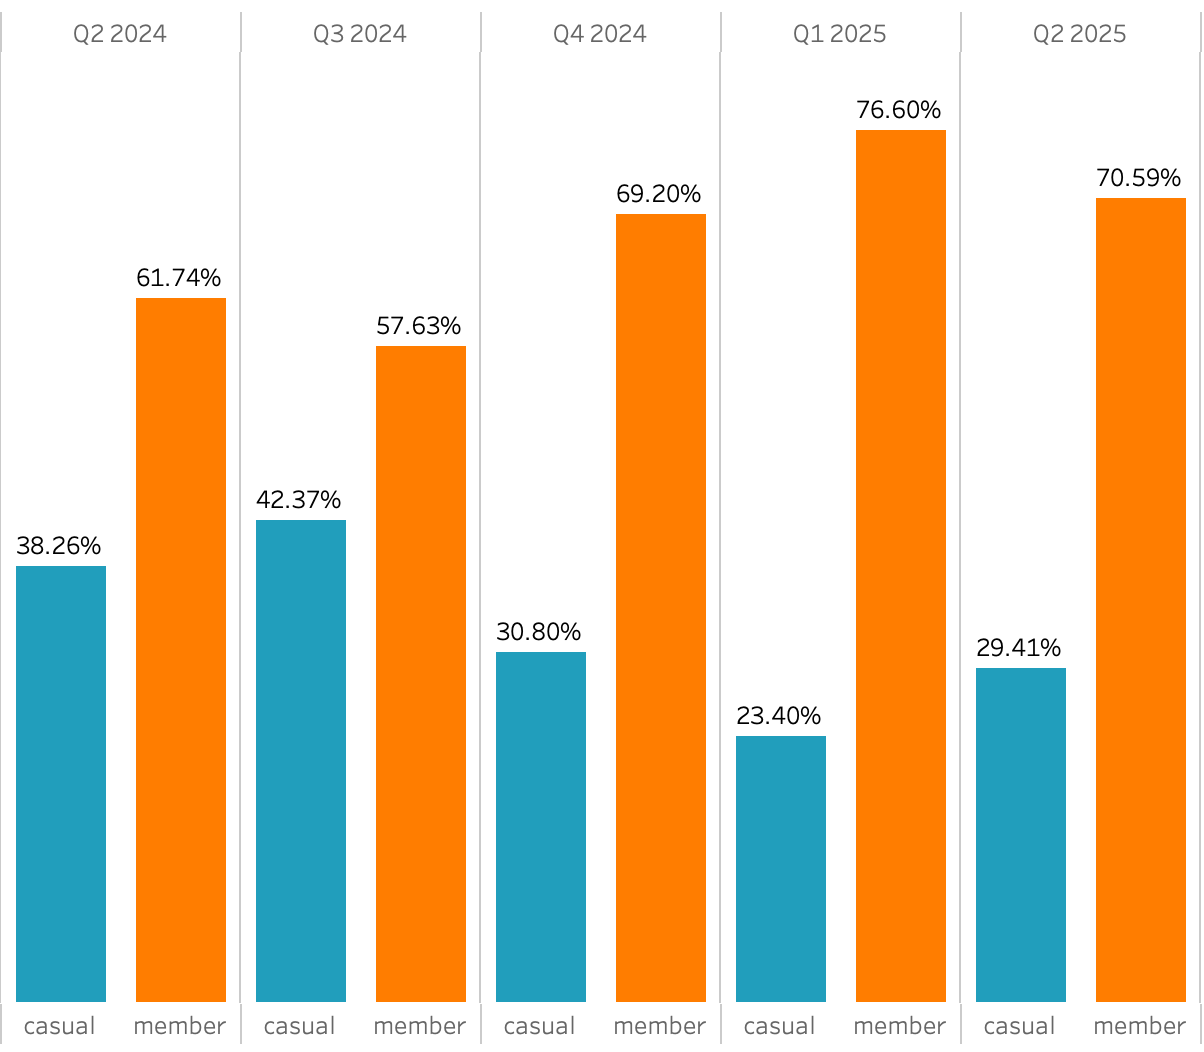
Fig 14: Seasonal trend chart
Location
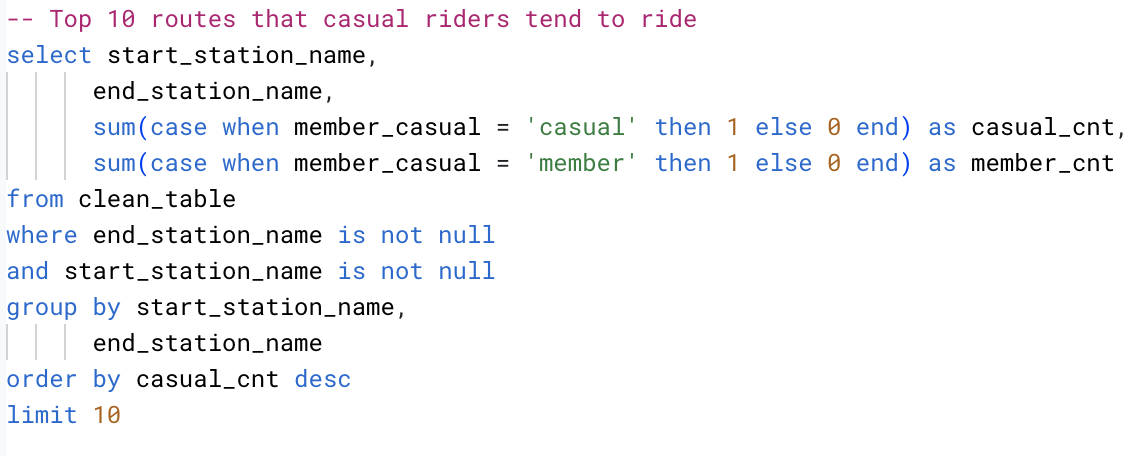
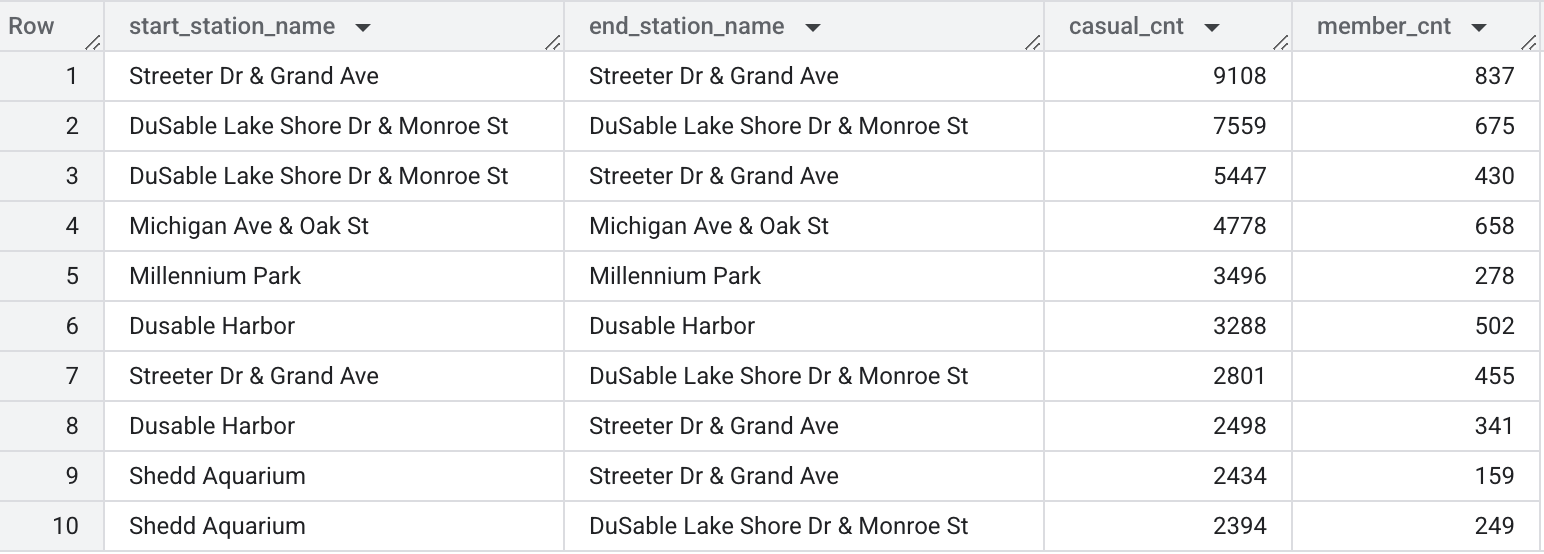
Fig 15: Query to get top 10 Start and End Stations
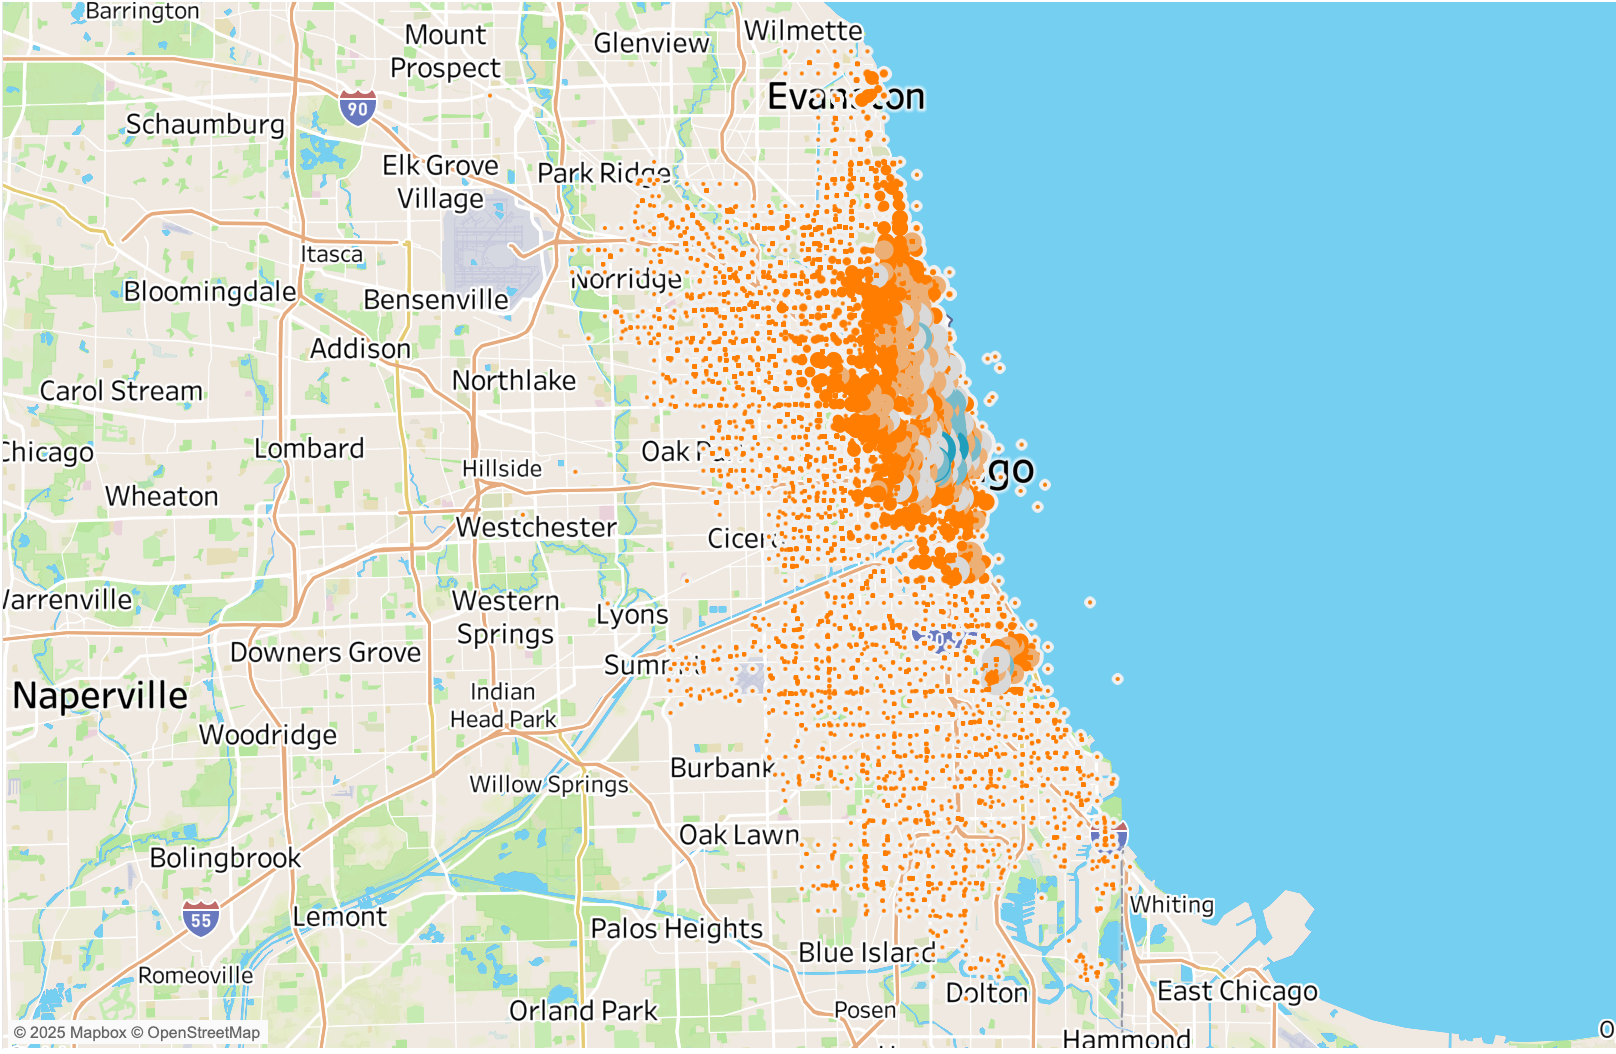
Fig 16: Member Start Stations Heatmap
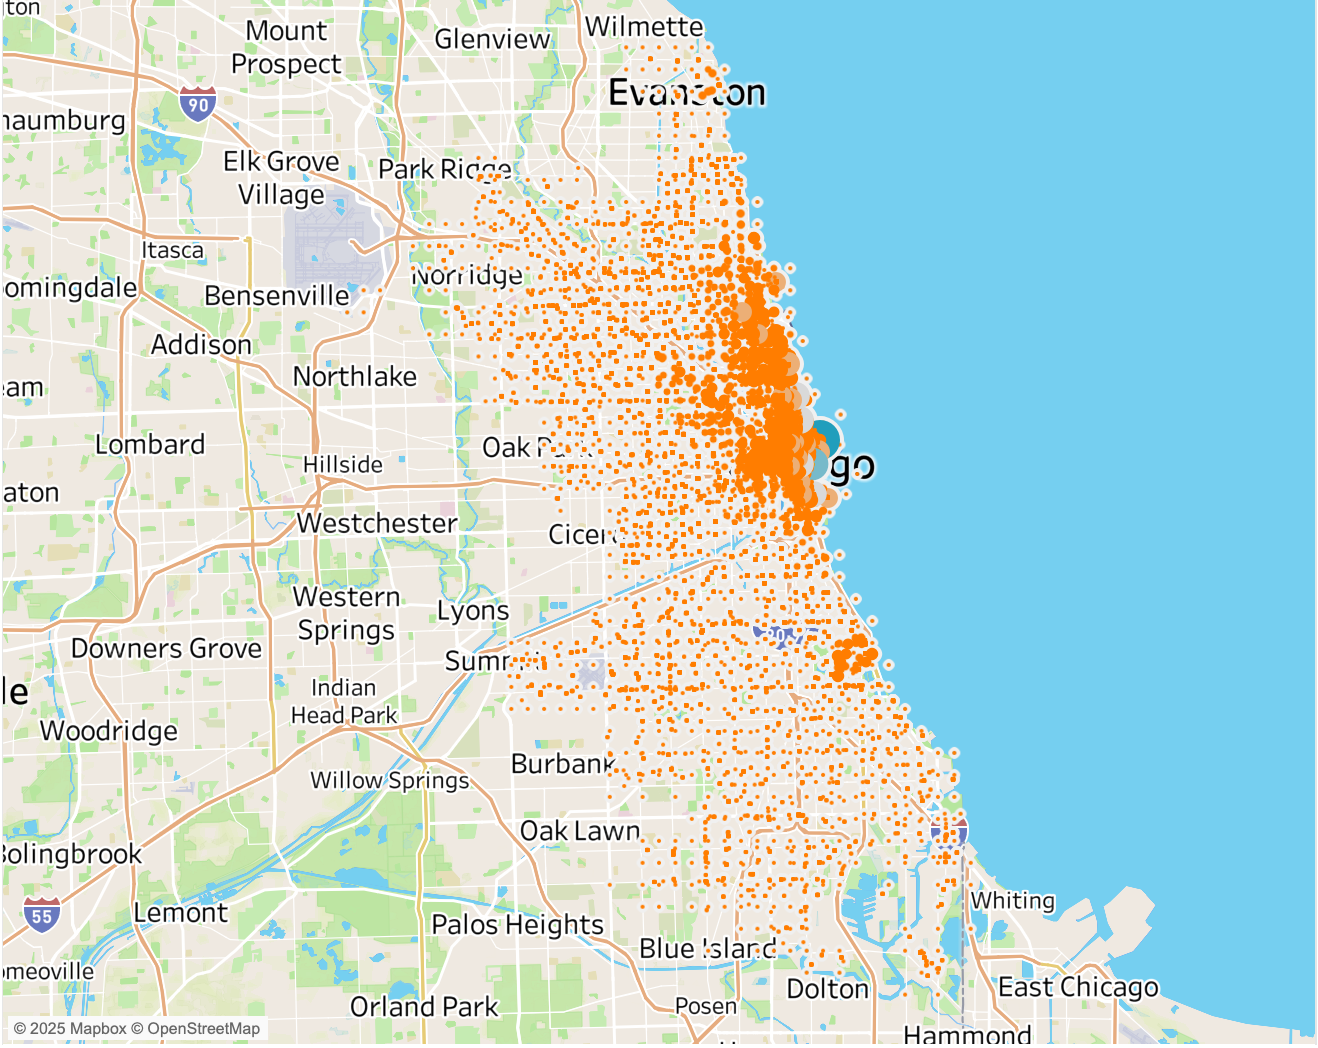
Fig 17: Casual Start Stations Heatmap
- Member exhibit a widely distributed network of start stations, covering suburban areas such as Barrington, Schaumburg, Naperville, and Wheaton, as well as transit-linked hubs like Arlington Heights and Glenview.
- This spread suggests that member use bike-share as part of their daily commuting routines, integrating it with other transportation modes across a broad geographic area.
- Casual show highly concentrated usage at select stations, primarily in leisure and tourist-heavy zones like Park Ridge, Glenview, and Wilmette (near the Botanic Garden).
- Casual ridership is clustered around recreational hotspots rather than dispersed across commuter routes.
- Target: Casual riders in Park Ridge/Glenview (near member-heavy zones)
- "Your weekend rides could cover your commute! Try a 1-month membership trial."
- Partner with Metra: "Show train pass, get 20% off bike membership."
Recommendations
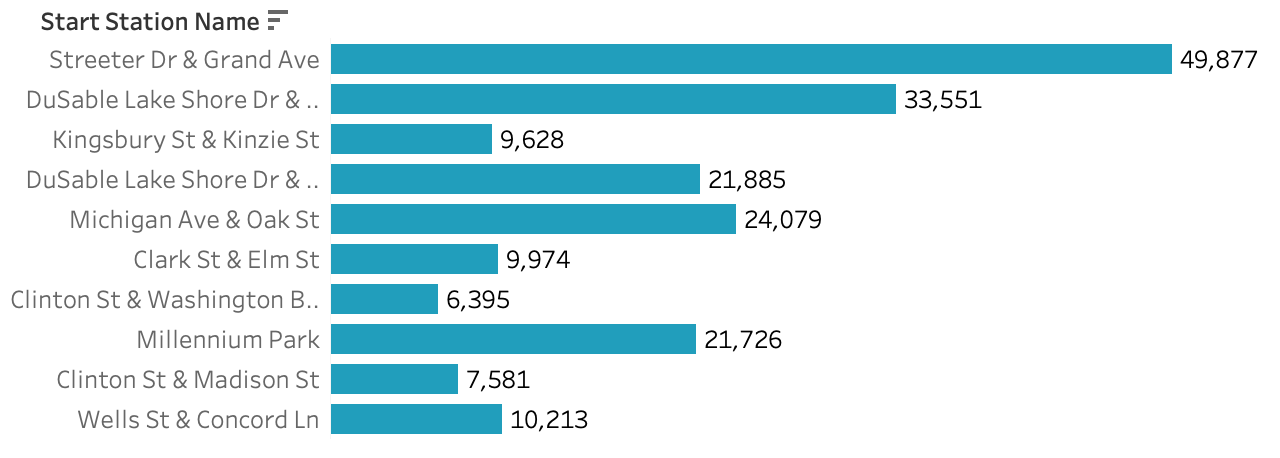
Fig 18: Casual Riders' Top 10 Start Stations
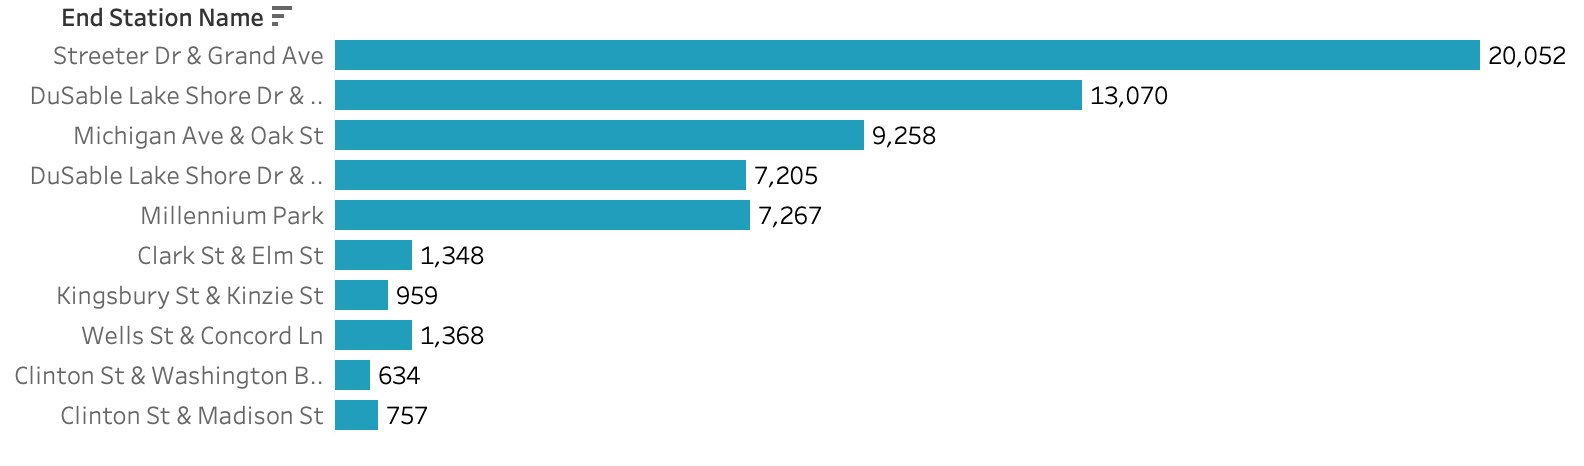
Fig 19: Casual Riders' Top 10 End Stations
- Based on the top 10 start/end stations for casual riders, we can identify key behavioral patterns and design targeted conversion strategies:
- Key Stations:
- Streeter Dr & Grand Ave (Top start/end)
- DuSable Lake Shore Dr (High start/end volume)
- Millennium Park (Popular destination)
- Partner with nearby attractions (Navy Pier, museums) to offer:
- "Explore More" Membership: Discounted admission + unlimited rides
- Weekend Pass Upgrade: "Get 3 days of rides for the price of 2"
- App Notifications: "You’ve started 10+ rides at [Station]. Upgrade to save 30%!"
- Kiosk Promotions: QR codes at docks: "Scan to unlock member rates"
Recommendations
5. Key Findings
Usage Patterns
- Members show consistent weekday usage (7-9 AM and 4-6 PM peaks) for work commutes
- Casual riders peak on weekends and midday (12-4 PM) for leisure activities
Ride Duration
- Members average 11-12 minute rides (short, efficient trips)
- Casual riders take significantly longer rides (21-28 minutes) suggesting recreational use
Seasonal Trends
- Casual ridership spikes 20% in summer (Q3) compared to winter lows
- Member usage remains steady year-round
Geographic Behavior
- Members are spread across suburban/transit hubs
- Casual riders cluster at tourist/recreational areas
6. Top Recommendations
- Weekend-focused membership trials for casual riders
- Afternoon explorer programs (12-4 PM flat-rate packages)
- Tourist attraction partnerships with membership bundles
- Commuter-match pricing for casuals making regular morning rides
- Long-ride rewards program
 View Analysis Code