COVID-19 Data Analysis
Project Overview
This project leverages datasets from Our World in Data to explore critical aspects of the COVID-19 pandemic. The two datasets used are:
- CovidVaccinations.csv: Contains information about vaccination rollouts worldwide.
- CovidDeaths.csv: Provides details about COVID-19 deaths across different countries and regions.
By combining these datasets, the project aims to uncover insights into how vaccination efforts impacted mortality rates globally and regionally.
Why I Chose This Project
COVID-19 has been a defining event of our time, profoundly affecting millions of lives. As someone passionate about data analysis, I believe that exploring such impactful data is an opportunity to better understand the pandemic's dynamics and to contribute to meaningful insights. Through this project, I aim to:
- Understand trends in COVID-19 deaths and vaccinations.
- Analyze relationships between vaccination rates and mortality trends.
- Enhance my ability to clean, visualize, and interpret real-world datasets.
What I Learned
By completing this project, I gained valuable experience in:
Data Wrangling
- Cleaning and preprocessing datasets to make them analysis-ready.
- Handling missing values and ensuring data consistency.
Exploratory Data Analysis (EDA)
- Exploring trends, patterns, and correlations within the datasets using Python and SQL.
- Identifying key insights into vaccination and mortality trends.
Data Visualization
- Creating intuitive visualizations to communicate findings effectively using Tableau and Python libraries like Matplotlib and Seaborn.
Insights and Storytelling
- Deriving actionable insights from data and presenting them in a compelling narrative format.
Project Goals
- Analyze Global Trends: Examine how vaccination rates and COVID-19 deaths have evolved globally over time.
- Impact Analysis: Investigate the impact of vaccination on reducing COVID-19 mortality.
- Regional Insights: Identify disparities and trends in different countries or regions.
How the Dashboard Looks
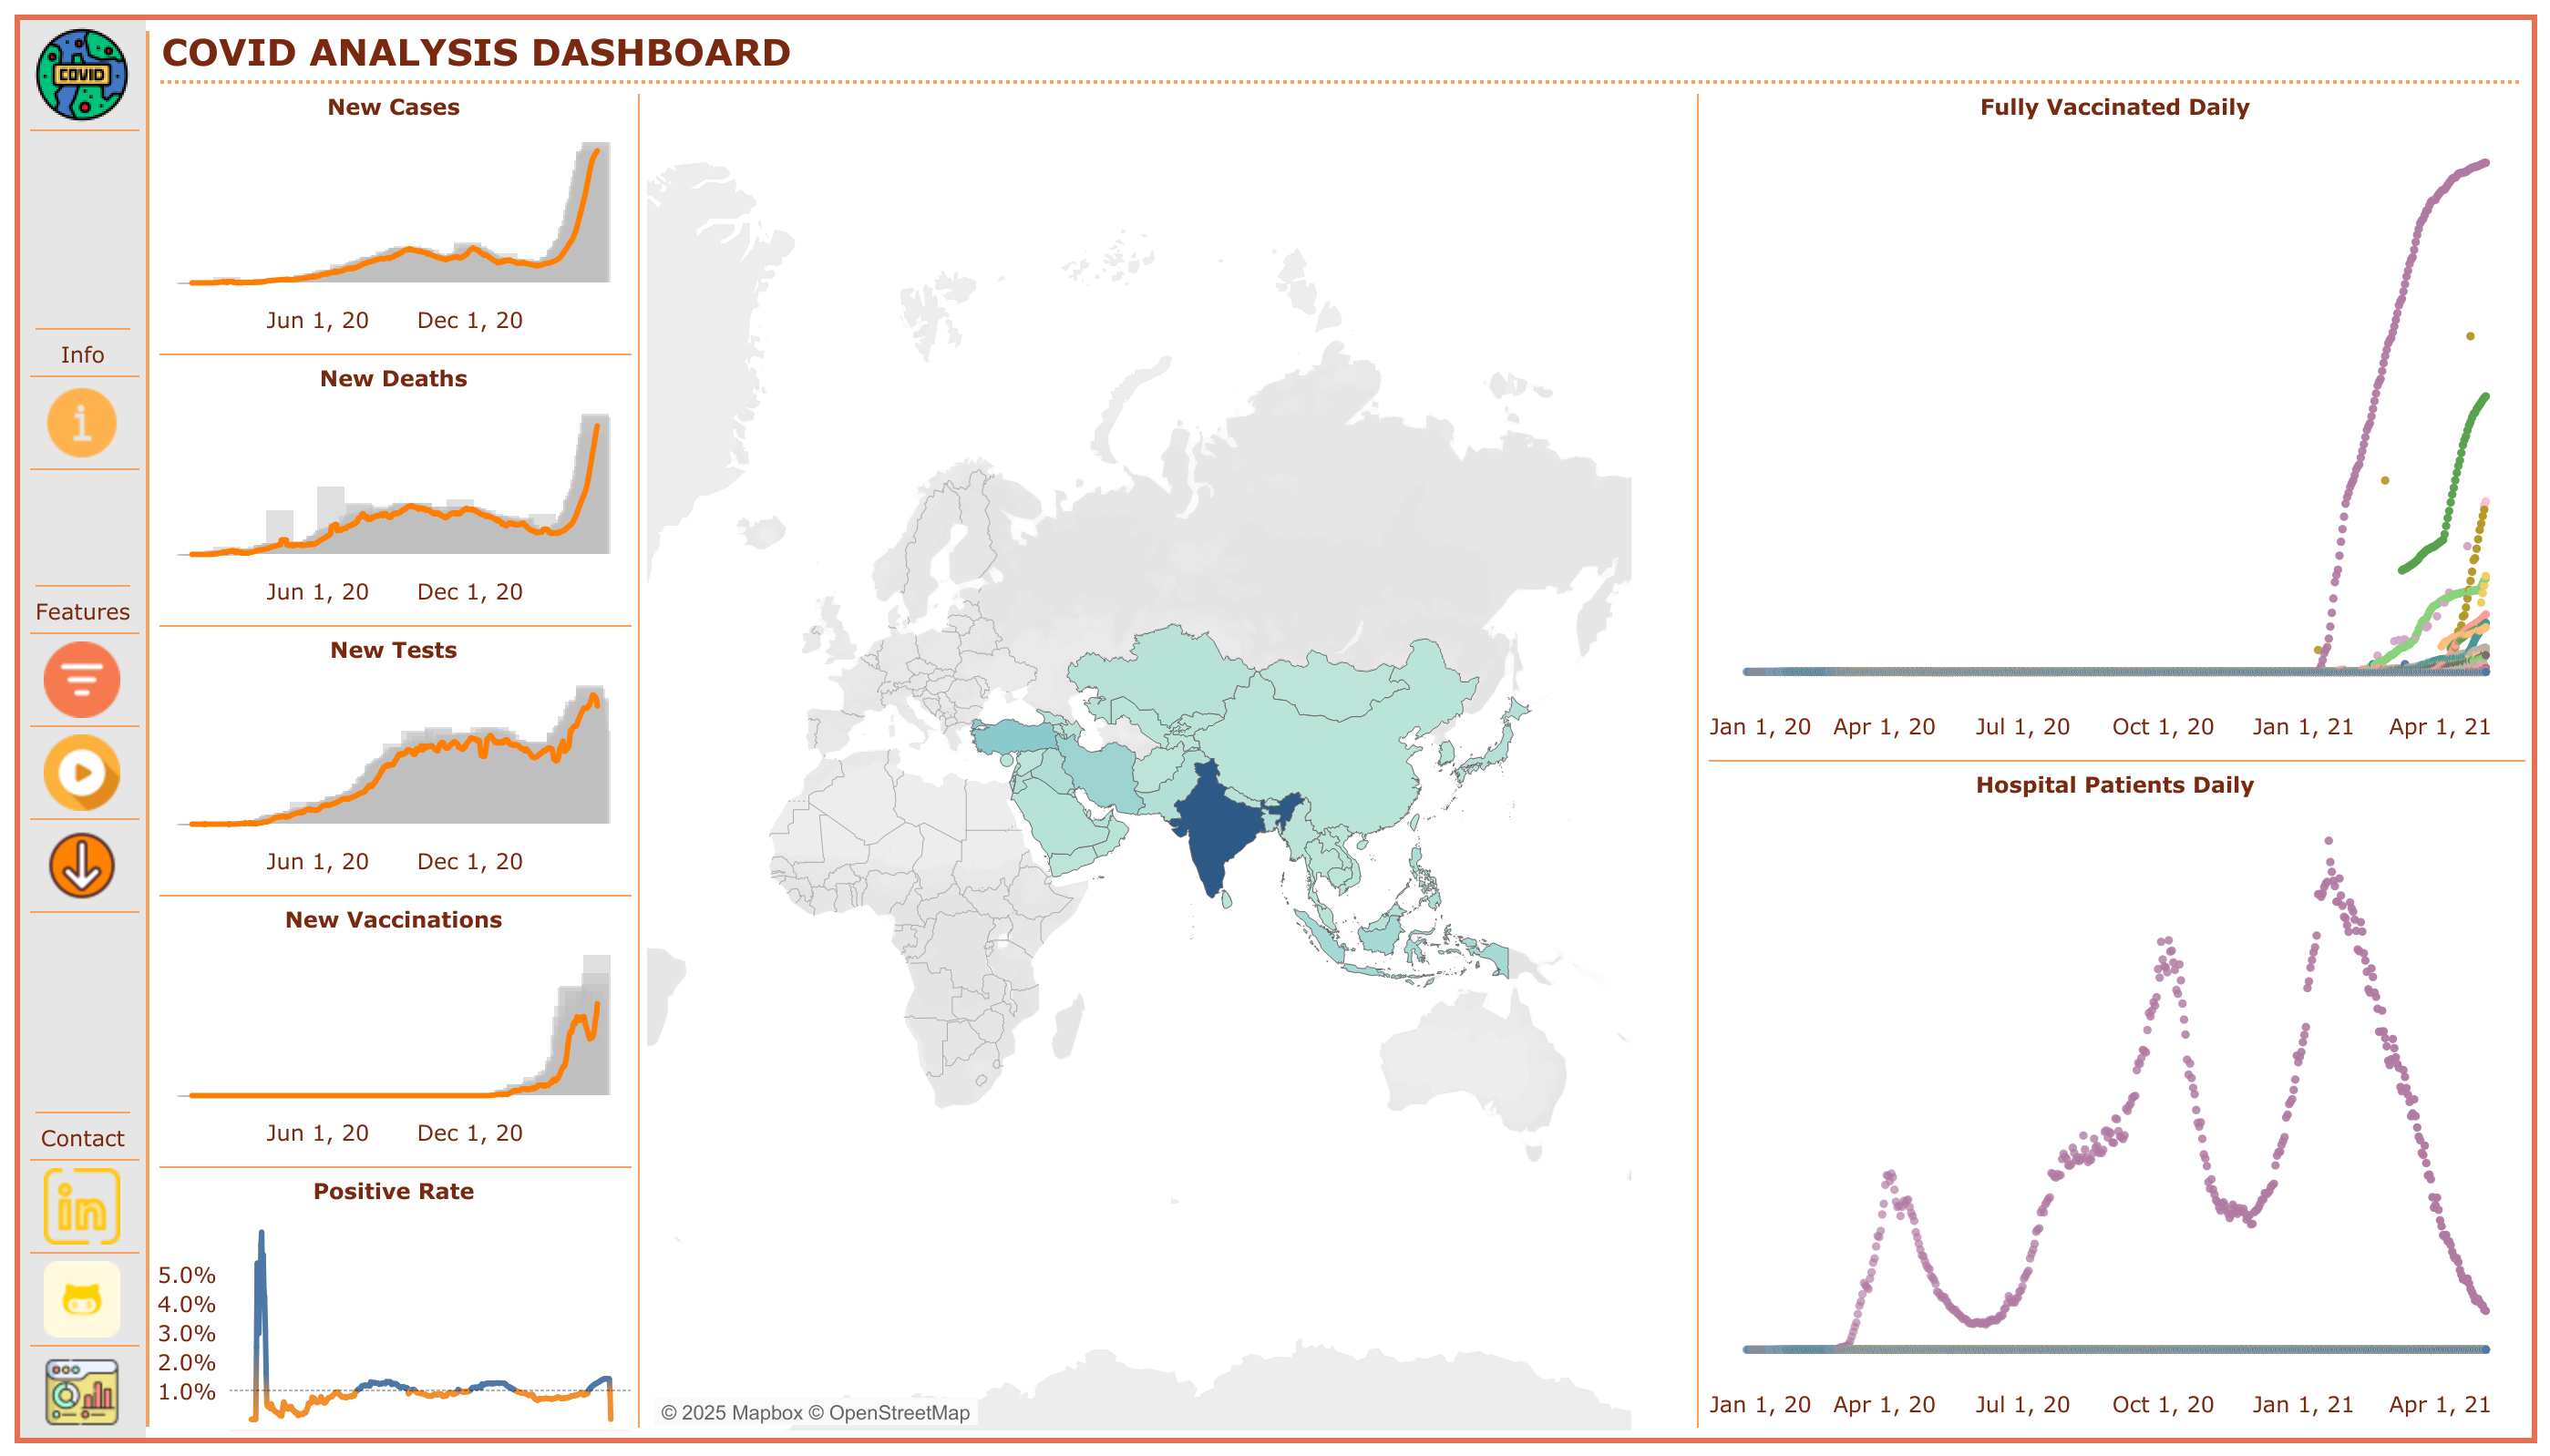
Interactive Dashboard
Explore the full interactive COVID-19 Data Analysis dashboard on Tableau Public:
GitHub Analysis
For a detailed look at the code and analysis process, visit my GitHub repository:
In the repository, you'll find:
- SQL Queries: For data cleaning, transformation, and analysis.
- Python Scripts: For exploratory data analysis (EDA) and preprocessing.
- Jupyter Notebooks: For step-by-step explanations of the analysis process.
- Documentation: Detailed explanations of the methodology and findings.
Data Source
The datasets used in this project are publicly available and can be accessed from Our World in Data.
Acknowledgments
Special thanks to Our World in Data for making this data accessible to researchers and enthusiasts worldwide.
Next Steps
- Advanced Analysis: Dive deeper into correlations and trends using advanced techniques.
- Documentation and Presentation: Summarize the findings in a report and interactive visualizations.