Inside Airbnb: San Francisco Data Analysis
Project Overview
This project analyzes the Airbnb listings in San Francisco, sourced from the Inside Airbnb project. As one of the top tourist destinations, San Francisco's housing market has been significantly impacted by the rise of short-term rentals like Airbnb. The aim of this project is to gain insights into the distribution, pricing, and availability of these listings across the city through SQL queries and Tableau visualizations.
The dataset provides a wealth of information, including listing prices, locations, availability, and host details. These variables will be explored through structured queries and interactive visualizations to uncover important trends and patterns.
Why I Chose This Project
This project was chosen for several key reasons:
- Housing Market Relevance: San Francisco is at the center of many discussions about housing affordability and short-term rentals. Analyzing Airbnb data helps provide a better understanding of how short-term rentals may be influencing the housing market and urban landscape.
- SQL and Tableau Proficiency: This project offers the opportunity to apply and showcase my SQL querying skills for data extraction and cleaning. Additionally, I will use Tableau to build interactive dashboards that provide an engaging way to present insights.
- Practical Insights: The analysis will allow us to explore neighborhood-level impacts, pricing strategies, and availability trends, all of which are relevant to property owners, renters, and policymakers.
What I Learned
In this project, I gained valuable experience in:
Querying Airbnb Data with SQL
- Extracting key information from the dataset, such as average prices by neighborhood, the number of listings per host, and availability trends over time.
- Cleaning, transforming, and filtering data using advanced SQL queries.
Visualizing Data in Tableau
- Creating interactive dashboards to visualize listing density, price distribution, and availability patterns across San Francisco.
- Using Tableau to communicate complex insights effectively.
Gaining Market Insights
- Understanding how Airbnb listings are affecting different areas of the city.
- Identifying trends in rental prices, availability, and host activity over time.
Dataset
The dataset is sourced from the Inside Airbnb website and contains detailed information about listings in San Francisco.
File used: listings.csv (Includes
detailed attributes such as price, location, availability, host
information, and more).
How the Dashboard Looks
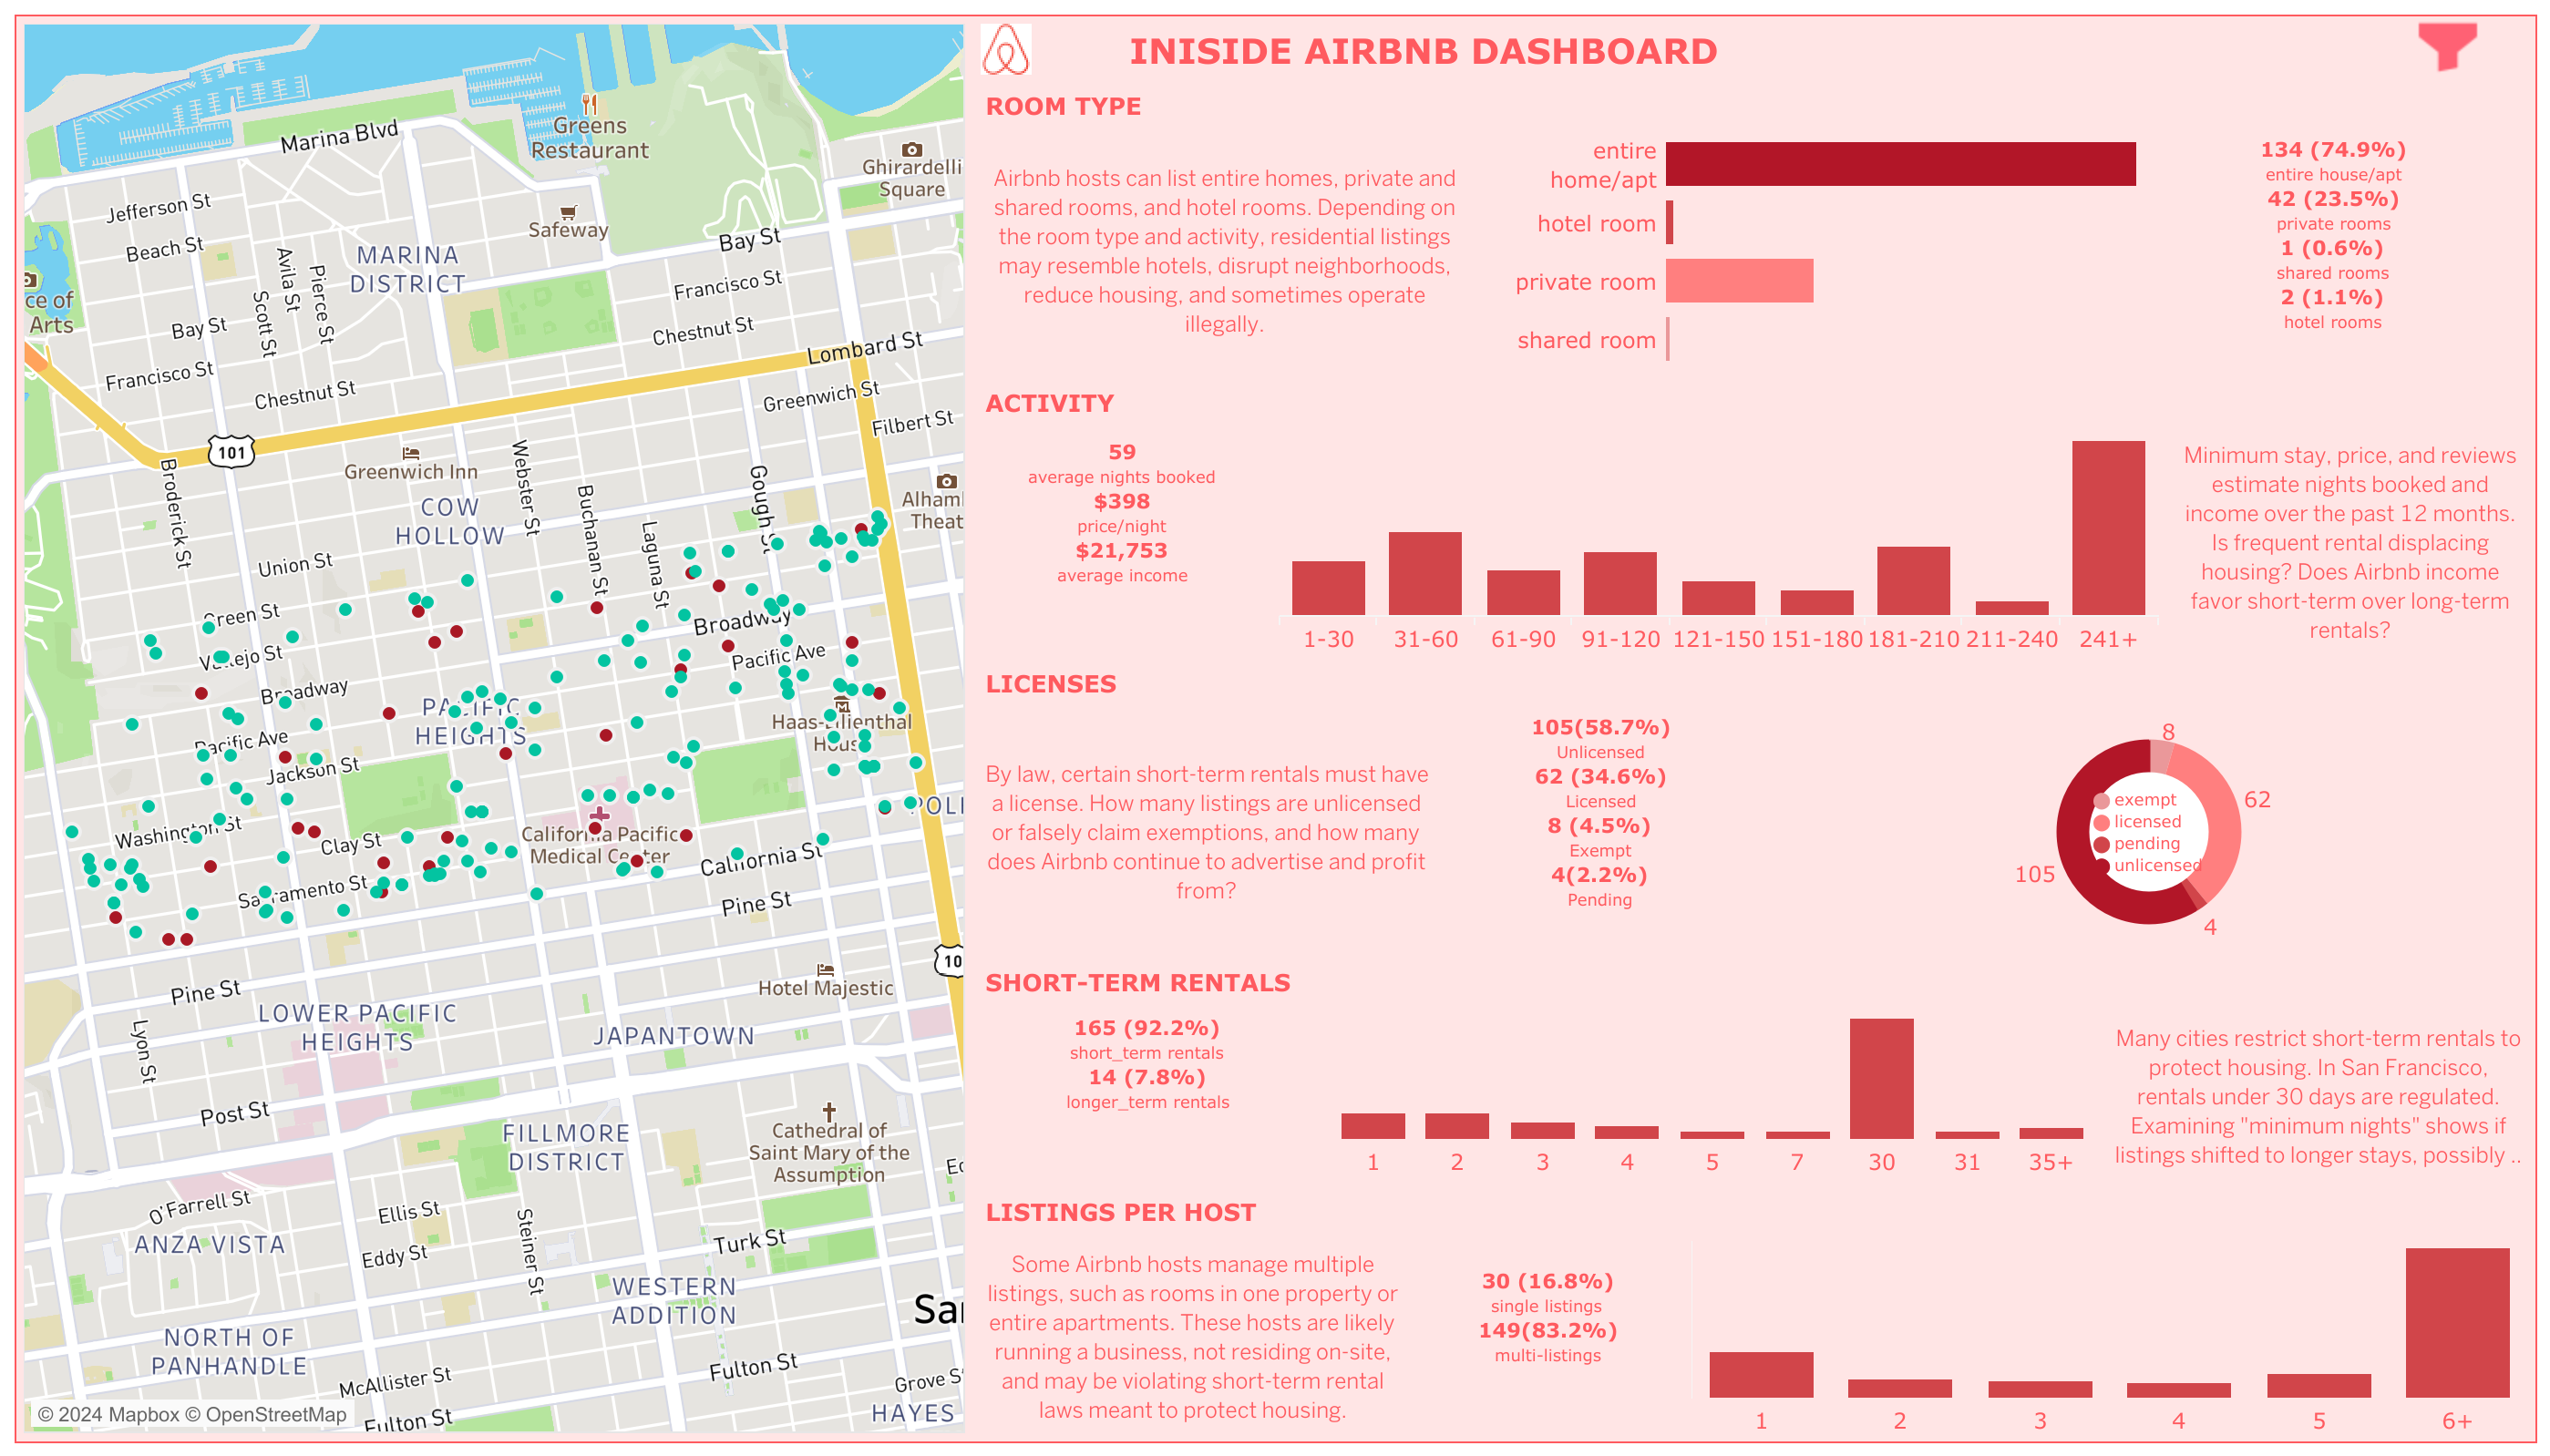
Interactive Dashboard
Explore the full interactive Airbnb Analysis dashboard on Tableau Public:
GitHub Analysis
For a detailed look at the code and analysis process, visit my GitHub repository:
In the repository, you'll find:
- SQL Scripts: For data cleaning, transformation, and analysis.
- Tableau Workbook: Containing the visualizations.
- Documentation: Detailed explanations of the methodology and findings.
Tools and Technologies
- SQL: For querying and manipulating the dataset to extract meaningful information.
- Tableau: For creating visualizations and dashboards that present the findings in a clear and interactive way.
Conclusion
By the end of this project, I gained a deep understanding of the Airbnb market in San Francisco. The combination of SQL for data extraction and Tableau for visualization enabled me to communicate complex insights effectively. This project enhanced my proficiency in data querying and dashboard creation, key skills for any data-driven role.